

Uniswap risks further declines as RSI approaches oversold territory: weekly analysis

Uniswap (UNI) is trading near $7.35 after declining a little more than 4% over the past week, with sellers maintaining control as technical signals stay bearish and price action remains deep in oversold territory. This sustained weakness is matched by continued pressure seen on the daily chart, where losing momentum has yet to find a reversal — setting a cautious backdrop for the week ahead.
 7.407
7.5210
Highlights
- Uniswap fell 4.06% over the past week to $7.352 and trades below its short-term moving averages.
- Technical indicators MacD, ADX, and RSI all suggest bearish momentum with the asset approaching but not yet at oversold conditions.
- Uniswap is forecast to consolidate in the $6.8556 to $8.627 range, with key support at $6.742 and resistance at $7.6386.
Protocol revenue records and Binance reserve drop counter ongoing derivatives selling
Uniswap set an all-time high for protocol revenue in September 2026, reaching $14.81 million, with Robinhood Chain driving more than half of this figure, according to CryptoBriefing. The platform rolled out dynamic fees for the ETH/USDC pair on Ethereum mainnet, adjusting fees in real time to reflect market volatility. The CME Group will launch Uniswap futures contracts on October 19, 2026, adding a regulated derivatives option amid ongoing selling pressure in the derivatives market. Meanwhile, UNI reserves on Binance have dropped sharply since October 10, reducing immediate selling pressure but raising questions about distribution.
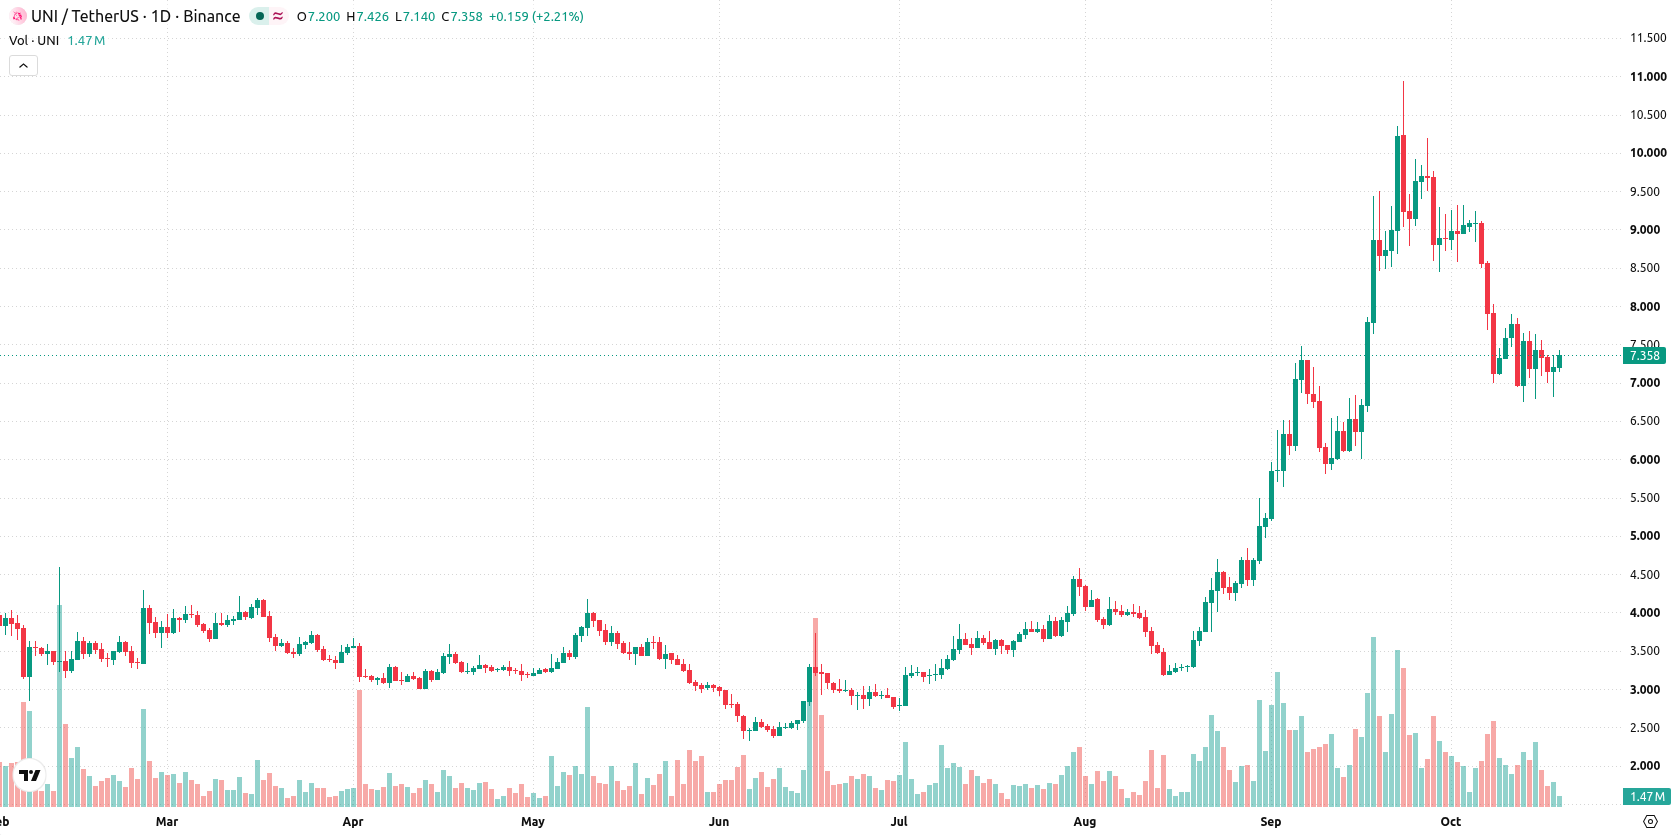
Bearish momentum stretches as MACD, ADX, and RSI signal downside risk
On the daily chart, Uniswap shows a sustained move lower with a firm trend and volatility at 13.91%. The MACD and ADX are both signaling sell, while the RSI at 39.8081 is approaching oversold, suggesting bearish momentum may be becoming stretched but has not reversed. Immediate support is located at $6.742, with resistance at $7.6386 from the 50-day moving average, and the Ichimoku Kijun at $8.842 remains a notable barrier.
Range consolidation likely as breakout risk looms above key resistance
Over the coming week, Uniswap is expected to trade between $6.8556 and $8.627, with a 43% probability of an increase and a 57% probability of a decrease. The base case sees price holding within this range, consolidating above $6.742 support. A decisive move above $7.6386 would indicate potential for further gains toward $8.627, while a break below $6.742 would open the door for additional downside.
Earlier, analysts noted that while Uniswap’s evolving fee structure and protocol upgrades suggested long-term technical strength, the token continued to face persistent short- and medium-term seller pressure. The current trend supports this perspective, with continued bearish signals and volatility reinforcing the importance of monitoring support at $6.742 as the next critical level for potential downside.






Latest Uniswap (UNI) News




-
 Afghanistan
-
 Albania
-
 Algeria
-
 Angola
-
 Argentina
-
 Armenia
-
 Australia
-
 Austria
-
 Azerbaijan
-
 Bahamas
-
 Bahrain
-
 Bangladesh
-
 Belarus
-
 Belgium
-
 Bolivia
-
 Botswana
-
 Brazil
-
 Brunei
-
 Bulgaria
-
 Cambodia
-
 Cameroon
-
 Canada
-
 Chile
-
 China
-
 Colombia
-
 Congo
-
 Costa Rica
-
 Cote d'Ivoire
-
 Croatia
-
 Cuba
-
 Cyprus
-
 Czechia
-
 DR Congo
-
 Denmark
-
 Dominican Republic
-
 Ecuador
-
 Egypt
-
 El Salvador
-
 Estonia
-
 Eswatini
-
 Ethiopia
-
 Finland
-
 France
-
 Georgia
-
 Germany
-
 Ghana
-
 Greece
-
 Haiti
-
 Hong Kong
-
 Hungary
-
 India
-
 Indonesia
-
 Iran, Islamic republic
-
 Iraq
-
 Ireland
-
 Israel
-
 Italy
-
 Jamaica
-
 Japan
-
 Jordan
-
 Kazakhstan
-
 Kenya
-
 Korea
-
 Kuwait
-
 Kyrgyzstan
-
 Laos
-
 Latvia
-
 Lebanon
-
 Lesotho
-
 Libya
-
 Lithuania
-
 Luxembourg
-
 Madagascar
-
 Malaysia
-
 Malta
-
 Mauritius
-
 Mexico
-
 Moldova
-
 Mongolia
-
 Montenegro
-
 Morocco
-
 Mozambique
-
 Myanmar
-
 Namibia
-
 Nepal
-
 Netherlands
-
 New Zealand
-
 Nigeria
-
 North Macedonia
-
 Norway
-
 Oman
-
 Pakistan
-
 Palestine
-
 Panama
-
 Papua New Guinea
-
 Paraguay
-
 Peru
-
 Philippines
-
 Poland
-
 Portugal
-
 Puerto Rico
-
 Qatar
-
 Reunion
-
 Romania
-
 Rwanda
-
 Saudi Arabia
-
 Serbia
-
 Singapore
-
 Slovakia
-
 Slovenia
-
 Somalia
-
 South Africa
-
 Spain
-
 Sri Lanka
-
 Sweden
-
 Switzerland
-
 Syria
-
 Taiwan
-
 Tajikistan
-
 Tanzania
-
 Thailand
-
 Trinidad and Tobago
-
 Tunisia
-
 Turkey
-
 UAE
-
 Uganda
-
 Ukraine
-
 United Kingdom
-
United States
-
 Uruguay
-
 Uzbekistan
-
 Venezuela
-
 Vietnam
-
 Yemen
-
 Zambia
-
 Zimbabwe
- Forex
- Crypto












