

Meritz Securities MOU and buyback coincide as Optimism price holds above key support

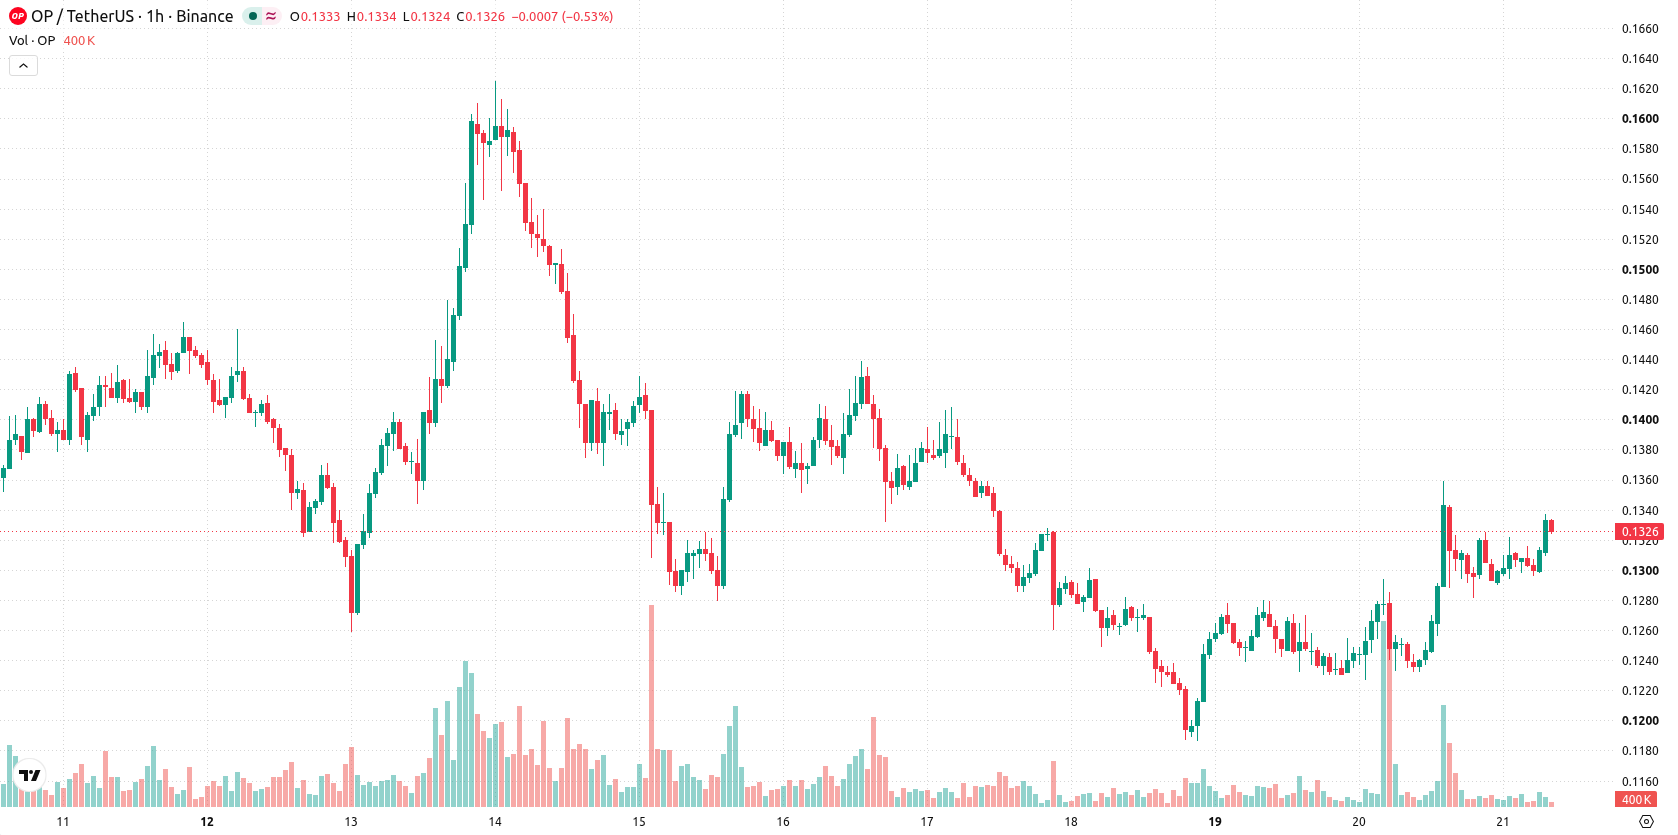
Optimism (OP) is trading at $0.1326, up 5.91% on the day, with the price currently above its key moving averages. This placement reflects strong momentum and continued demand through the latest trading session.
 0.1164
0.1228
Highlights
- Meritz Securities has agreed with the Optimism Foundation to introduce tokenized asset issuance and trading on the OP Mainnet, formalizing institutional involvement.
- Optimism has executed a buyback totaling over 9.4 million OP tokens, and a large wallet acquired 3 million tokens worth about $3.855 million.
- OP/USD trades with strong bullish momentum, robust indicator support, and a high probability of moving within the $0.1131 to $0.1383 range over the next few days.
Institutional partnership and buyback drive demand and supply shift
Meritz Securities has entered into a memorandum of understanding with the Optimism Foundation to collaborate on issuing, settling, and trading tokenized financial assets on the OP Mainnet, according to Sedaily. This partnership formalizes institutional participation in the Optimism ecosystem and is likely to drive new demand for the network’s infrastructure. In addition, Optimism’s approved buyback program has completed purchases totaling more than 9.4 million OP tokens, which reduces circulating supply and strengthens price support, as reported by Tokenpost. A large wallet’s recent accumulation of 3 million OP tokens valued at approximately $3.855 million further signals private investor interest in the token.
Strong buy signals as OP breaks technical resistance levels
On the technical chart, OP trades above the MA-20 ($0.1305) and MA-50 ($0.1272) on the hourly timeframe, and well above the longer-term MA-200 ($0.1123) on the daily chart. The Ichimoku Kijun level at $0.1296 stands as immediate support, while the most recent daily high aligns as near-term resistance. MACD signals a Strong Buy, ADX gives a Buy call, and both CCI and Bull/Bear Power support upward momentum, while RSI reads at 60. Stochastic RSI and the Awesome Oscillator are neutral, reflecting a potential for sideways movement or a short pause.
Consolidation likely as volatility surrounds breakout risk
Over the next two to three trading days, the projected price range for OP is $0.1131 to $0.1383, in line with the current volatility band relative to recent levels. The baseline scenario sees consolidation within this range unless a break above near-term resistance occurs, which could trigger further bullish momentum. Should price drop below the Ichimoku Kijun support, the outlook may shift towards increased short-term downside risk.
In a recent review, analysts highlighted a shift toward bullish momentum for Optimism, driven by reduced token supply and notable accumulation. The current article builds on this outlook by noting new institutional developments and technical strength, with traders advised to monitor the Ichimoku Kijun level at $0.1296 as a key support for near-term price action.










-
 Afghanistan
-
 Albania
-
 Algeria
-
 Angola
-
 Argentina
-
 Armenia
-
 Australia
-
 Austria
-
 Azerbaijan
-
 Bahamas
-
 Bahrain
-
 Bangladesh
-
 Belarus
-
 Belgium
-
 Bolivia
-
 Botswana
-
 Brazil
-
 Brunei
-
 Bulgaria
-
 Cambodia
-
 Cameroon
-
 Canada
-
 Chile
-
 China
-
 Colombia
-
 Congo
-
 Costa Rica
-
 Cote d'Ivoire
-
 Croatia
-
 Cuba
-
 Cyprus
-
 Czechia
-
 DR Congo
-
 Denmark
-
 Dominican Republic
-
 Ecuador
-
 Egypt
-
 El Salvador
-
 Estonia
-
 Eswatini
-
 Ethiopia
-
 Finland
-
 France
-
 Georgia
-
 Germany
-
 Ghana
-
 Greece
-
 Haiti
-
 Hong Kong
-
 Hungary
-
 India
-
 Indonesia
-
 Iran, Islamic republic
-
 Iraq
-
 Ireland
-
 Israel
-
 Italy
-
 Jamaica
-
 Japan
-
 Jordan
-
 Kazakhstan
-
 Kenya
-
 Korea
-
 Kuwait
-
 Kyrgyzstan
-
 Laos
-
 Latvia
-
 Lebanon
-
 Lesotho
-
 Libya
-
 Lithuania
-
 Luxembourg
-
 Madagascar
-
 Malaysia
-
 Malta
-
 Mauritius
-
 Mexico
-
 Moldova
-
 Mongolia
-
 Montenegro
-
 Morocco
-
 Mozambique
-
 Myanmar
-
 Namibia
-
 Nepal
-
 Netherlands
-
 New Zealand
-
 Nigeria
-
 North Macedonia
-
 Norway
-
 Oman
-
 Pakistan
-
 Palestine
-
 Panama
-
 Papua New Guinea
-
 Paraguay
-
 Peru
-
 Philippines
-
 Poland
-
 Portugal
-
 Puerto Rico
-
 Qatar
-
 Reunion
-
 Romania
-
 Rwanda
-
 Saudi Arabia
-
 Serbia
-
 Singapore
-
 Slovakia
-
 Slovenia
-
 Somalia
-
 South Africa
-
 Spain
-
 Sri Lanka
-
 Sweden
-
 Switzerland
-
 Syria
-
 Taiwan
-
 Tajikistan
-
 Tanzania
-
 Thailand
-
 Trinidad and Tobago
-
 Tunisia
-
 Turkey
-
 UAE
-
 Uganda
-
 Ukraine
-
 United Kingdom
-
United States
-
 Uruguay
-
 Uzbekistan
-
 Venezuela
-
 Vietnam
-
 Yemen
-
 Zambia
-
 Zimbabwe
- Forex
- Crypto












