

Will Polygon avoid deeper losses as sellers maintain control of the trend?

Polygon (POL) is trading at $0.0901, posting a daily decline of 7.35%. The asset remains below its key short- and medium-term moving averages while retaining its position above the long-term trend indicator.
 0.0931
0.0965
Highlights
- Polygon has started the mainnet countdown for its 0xMiden project to expand interoperability and connect the first non-EVM chain to global liquidity via AggLayer.
- Hyperledger Besu now offers an enterprise cross-chain interoperability feature through AggLayer, advancing Polygon's infrastructure ambitions.
- POL/USD faces strong selling pressure with price expected to consolidate between $0.0879 and $0.0926 over the next two to three days, with further downside considered very likely.
Interoperability advances as infrastructure upgrades face selling pressure
Polygon has initiated the mainnet countdown for its 0xMiden project, a milestone aimed at expanding interoperability by connecting the first non-EVM chain to global liquidity through AggLayer, according to Coinfomania. This move illustrates concrete progress in Polygon's infrastructure ambitions, with a focus on broadening network connectivity and technical scope. Additionally, the October 19 highlight of Hyperledger Besu's AggLayer interoperability feature marks continued advancement in cross-chain enterprise blockchain solutions, also reported by Coinfomania, though price action has remained under broader selling pressure.
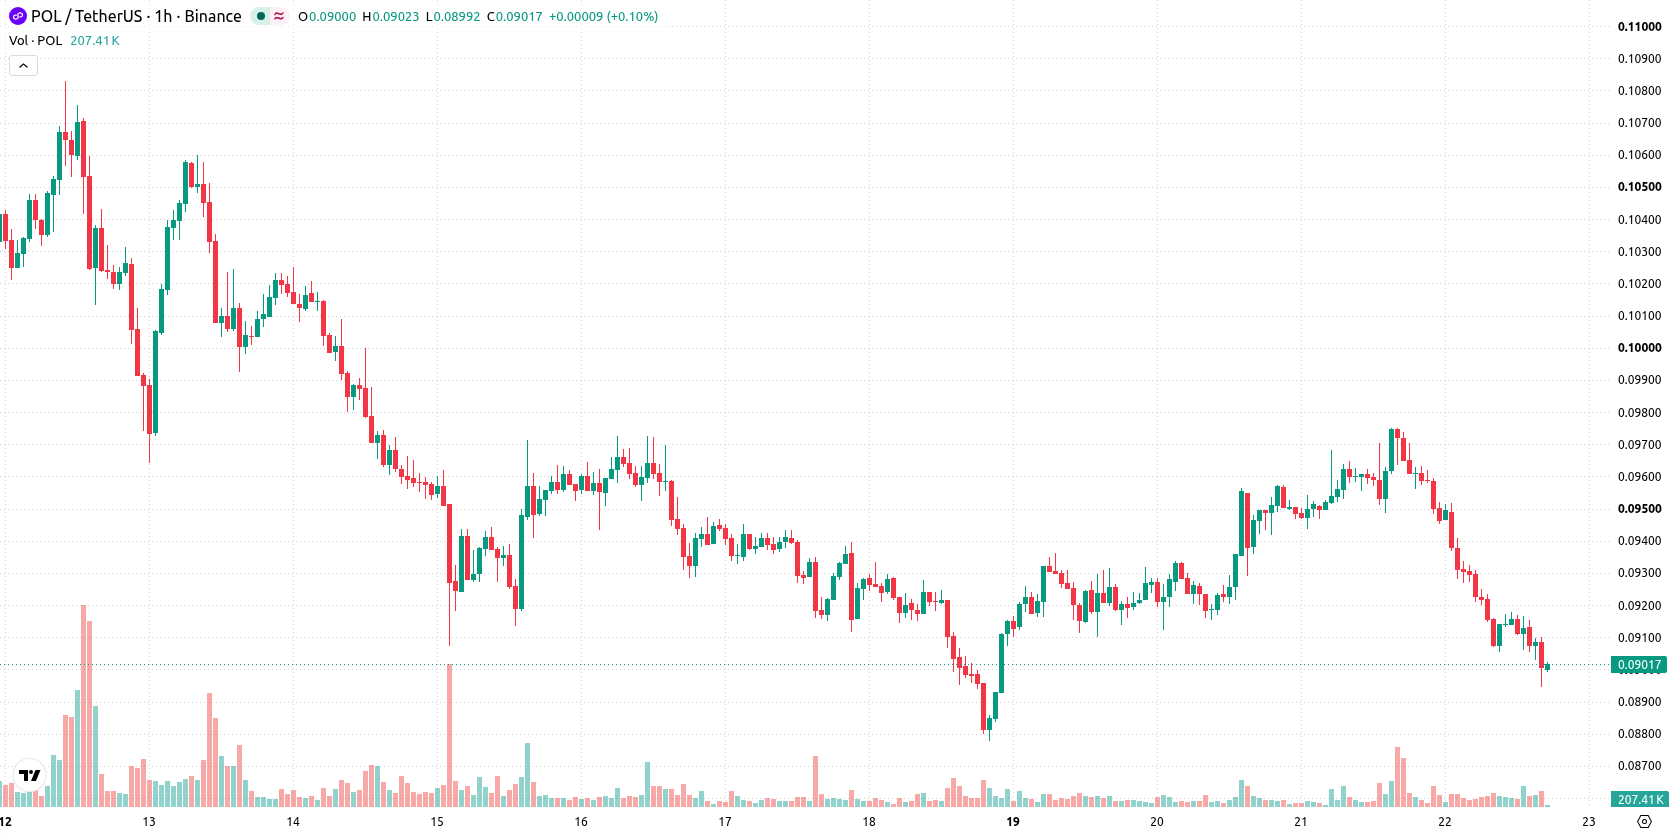
Bearish momentum builds as price holds key long-term support
POL/USD dipped below its MA-20 and MA-50, exposing short- and medium-term weakness, but remains above the MA-200, which presently acts as critical long-term support. The Ichimoku Kijun level at $0.0939 now serves as the closest resistance for recovery attempts. Key indicators show sustained bearish momentum: MACD and ADX both produced Sell signals, while the Awesome Oscillator and Bull/Bear Power confirm continued downside pressure. RSI at 29.34 and CCI also on Sell highlight clear oversold conditions. Stoch RSI signals a neutral stance, offering little immediate bias against the dominant negative technical setup.
Further declines likely as volatility bands and negative bias persist
Over the next 2 to 3 trading days, POL/USD is expected to fluctuate within a volatility band between $0.0879 and $0.0926. The probability of continued downside remains very high, with sellers likely to target a break below $0.0879 support as the next stage for further declines. A sustained recovery would first require regaining the $0.0939 resistance level marked by the Ichimoku Kijun, though the likelihood of such an upturn in the short term is seen as very low. In the base scenario, the price consolidates inside this corridor under ongoing pressure from negative momentum signals.
Previously it was reported that analysts anticipated continued consolidation for Polygon amid persistent downward momentum and critical support levels in focus. The current setup intensifies this outlook, as technical signals now point to high downside risk with sellers eyeing a potential break below $0.0879 in the days ahead.











-
 Afghanistan
-
 Albania
-
 Algeria
-
 Angola
-
 Argentina
-
 Armenia
-
 Australia
-
 Austria
-
 Azerbaijan
-
 Bahamas
-
 Bahrain
-
 Bangladesh
-
 Belarus
-
 Belgium
-
 Bolivia
-
 Botswana
-
 Brazil
-
 Brunei
-
 Bulgaria
-
 Cambodia
-
 Cameroon
-
 Canada
-
 Chile
-
 China
-
 Colombia
-
 Congo
-
 Costa Rica
-
 Cote d'Ivoire
-
 Croatia
-
 Cuba
-
 Cyprus
-
 Czechia
-
 DR Congo
-
 Denmark
-
 Dominican Republic
-
 Ecuador
-
 Egypt
-
 El Salvador
-
 Estonia
-
 Eswatini
-
 Ethiopia
-
 Finland
-
 France
-
 Georgia
-
 Germany
-
 Ghana
-
 Greece
-
 Haiti
-
 Hong Kong
-
 Hungary
-
 India
-
 Indonesia
-
 Iran, Islamic republic
-
 Iraq
-
 Ireland
-
 Israel
-
 Italy
-
 Jamaica
-
 Japan
-
 Jordan
-
 Kazakhstan
-
 Kenya
-
 Korea
-
 Kuwait
-
 Kyrgyzstan
-
 Laos
-
 Latvia
-
 Lebanon
-
 Lesotho
-
 Libya
-
 Lithuania
-
 Luxembourg
-
 Madagascar
-
 Malaysia
-
 Malta
-
 Mauritius
-
 Mexico
-
 Moldova
-
 Mongolia
-
 Montenegro
-
 Morocco
-
 Mozambique
-
 Myanmar
-
 Namibia
-
 Nepal
-
 Netherlands
-
 New Zealand
-
 Nigeria
-
 North Macedonia
-
 Norway
-
 Oman
-
 Pakistan
-
 Palestine
-
 Panama
-
 Papua New Guinea
-
 Paraguay
-
 Peru
-
 Philippines
-
 Poland
-
 Portugal
-
 Puerto Rico
-
 Qatar
-
 Reunion
-
 Romania
-
 Rwanda
-
 Saudi Arabia
-
 Serbia
-
 Singapore
-
 Slovakia
-
 Slovenia
-
 Somalia
-
 South Africa
-
 Spain
-
 Sri Lanka
-
 Sweden
-
 Switzerland
-
 Syria
-
 Taiwan
-
 Tajikistan
-
 Tanzania
-
 Thailand
-
 Trinidad and Tobago
-
 Tunisia
-
 Turkey
-
 UAE
-
 Uganda
-
 Ukraine
-
 United Kingdom
-
United States
-
 Uruguay
-
 Uzbekistan
-
 Venezuela
-
 Vietnam
-
 Yemen
-
 Zambia
-
 Zimbabwe
- Forex
- Crypto












