


Pepe (PEPE) retreated 12.05% following renewed attention sparked by a Pepe-themed post from Coinbase CEO Brian Armstrong, as well as increased whale accumulation. The intraday drop contradicts the strong bullish trend alignment, with the asset trading above all major moving averages and momentum indicators signaling continued buyer dominance.
 0.0535
0.054080
Highlights
- Coinbase CEO Brian Armstrong posted an image featuring Pepe, drawing significant community attention on October 23, 2026.
- A large wallet acquired 43.3 billion PEPE tokens as the pending PEPE spot ETF proposal by Canary Capital awaits a decision from the U.S. SEC.
- PEPE/USD trades above key moving averages with bullish technical momentum, an expected range of $0.00000373 to $0.00000517, and a sideways to upward bias over the next five days.
Whale buying and ETF anticipation undercut by persistent selling pressure
A widely-shared image featuring Pepe was posted by Coinbase CEO Brian Armstrong, generating significant community attention on October 23, 2026. Whale activity was reported, including the purchase of 43.3 billion PEPE tokens by a large wallet. A proposed PEPE spot ETF by Canary Capital remains pending with the U.S. SEC, with the latest amendment filed in October 2026, though price action has remained under broader selling pressure.
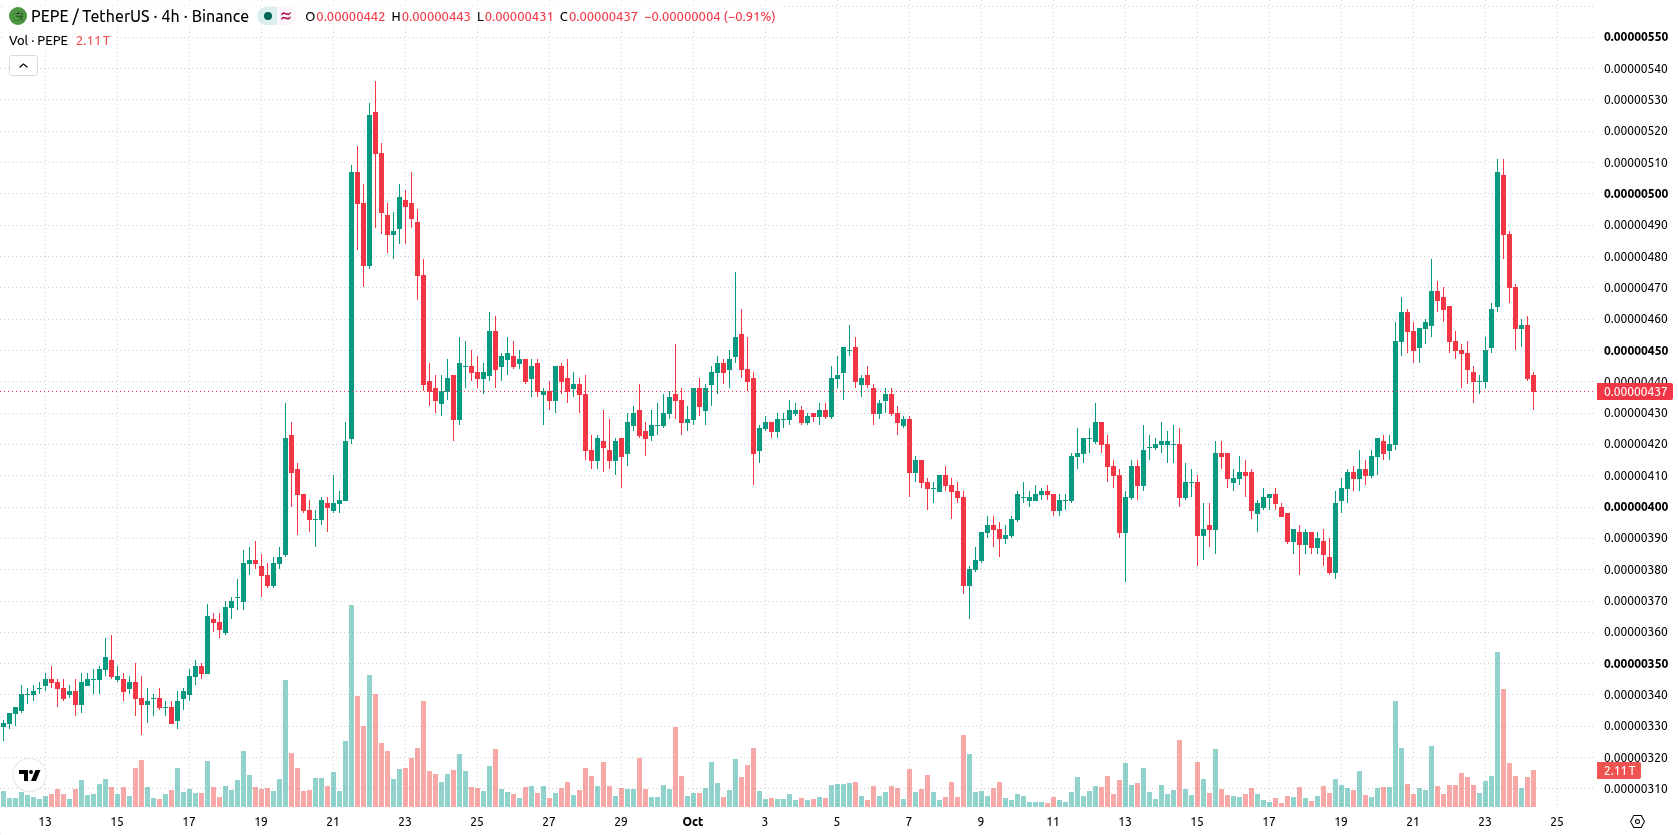
Momentum signals clash with overbought indicators amid volatility spike
PEPE/USD is trading above its 20-day, 50-day, and 200-day moving averages ($0.000004194, $0.000004041, and $0.00000344 respectively), indicating firm bullish undertones in short-, medium-, and long-term trend alignment. Immediate levels to watch are resistance at $0.0000046 and support at $0.000004375, while the longer-term outlook is reinforced by the bullish MA-50 vs MA-200 alignment. Momentum readings show the MACD and Average Directional Index (ADX) both signal a “Buy” setup, reinforcing constructive momentum. The Relative Strength Index (RSI) sits at 61.04 with a “Buy” forecast, yet both Stochastic RSI and Commodity Channel Index (CCI) flag overbought conditions at 94.57 and 174.77. Bull/Bear Power (BBP) remains in positive territory, confirming buyer dominance even as oscillators reveal clear overbought signals. After opening with a downside gap of about 8% and slipping 12.05% to $0.0000044, the pair is now near session lows with intraday volatility at 4.55%. The overall session tone reflects pressure after the open and a divergence between strong underlying momentum and short-term exhaustion signals.
Earlier, analysts noted that Pepe had shifted to a downside bias as technical signals pointed to sustained selling pressure and elevated volatility. The current article highlights a reversal in market structure, with bullish trend alignment now prevailing, making $0.0000046 a critical resistance level to monitor for any potential breakout.






Latest PEPE/USD News




-
 Afghanistan
-
 Albania
-
 Algeria
-
 Angola
-
 Argentina
-
 Armenia
-
 Australia
-
 Austria
-
 Azerbaijan
-
 Bahamas
-
 Bahrain
-
 Bangladesh
-
 Belarus
-
 Belgium
-
 Bolivia
-
 Botswana
-
 Brazil
-
 Brunei
-
 Bulgaria
-
 Cambodia
-
 Cameroon
-
 Canada
-
 Chile
-
 China
-
 Colombia
-
 Congo
-
 Costa Rica
-
 Cote d'Ivoire
-
 Croatia
-
 Cuba
-
 Cyprus
-
 Czechia
-
 DR Congo
-
 Denmark
-
 Dominican Republic
-
 Ecuador
-
 Egypt
-
 El Salvador
-
 Estonia
-
 Eswatini
-
 Ethiopia
-
 Finland
-
 France
-
 Georgia
-
 Germany
-
 Ghana
-
 Greece
-
 Haiti
-
 Hong Kong
-
 Hungary
-
 India
-
 Indonesia
-
 Iran, Islamic republic
-
 Iraq
-
 Ireland
-
 Israel
-
 Italy
-
 Jamaica
-
 Japan
-
 Jordan
-
 Kazakhstan
-
 Kenya
-
 Korea
-
 Kuwait
-
 Kyrgyzstan
-
 Laos
-
 Latvia
-
 Lebanon
-
 Lesotho
-
 Libya
-
 Lithuania
-
 Luxembourg
-
 Madagascar
-
 Malaysia
-
 Malta
-
 Mauritius
-
 Mexico
-
 Moldova
-
 Mongolia
-
 Montenegro
-
 Morocco
-
 Mozambique
-
 Myanmar
-
 Namibia
-
 Nepal
-
 Netherlands
-
 New Zealand
-
 Nigeria
-
 North Macedonia
-
 Norway
-
 Oman
-
 Pakistan
-
 Palestine
-
 Panama
-
 Papua New Guinea
-
 Paraguay
-
 Peru
-
 Philippines
-
 Poland
-
 Portugal
-
 Puerto Rico
-
 Qatar
-
 Reunion
-
 Romania
-
 Rwanda
-
 Saudi Arabia
-
 Serbia
-
 Singapore
-
 Slovakia
-
 Slovenia
-
 Somalia
-
 South Africa
-
 Spain
-
 Sri Lanka
-
 Sweden
-
 Switzerland
-
 Syria
-
 Taiwan
-
 Tajikistan
-
 Tanzania
-
 Thailand
-
 Trinidad and Tobago
-
 Tunisia
-
 Turkey
-
 UAE
-
 Uganda
-
 Ukraine
-
 United Kingdom
-
United States
-
 Uruguay
-
 Uzbekistan
-
 Venezuela
-
 Vietnam
-
 Yemen
-
 Zambia
-
 Zimbabwe
- Forex
- Crypto












