

Bitcoin price prediction: $76,284 support in focus? BTC drops 1.55%

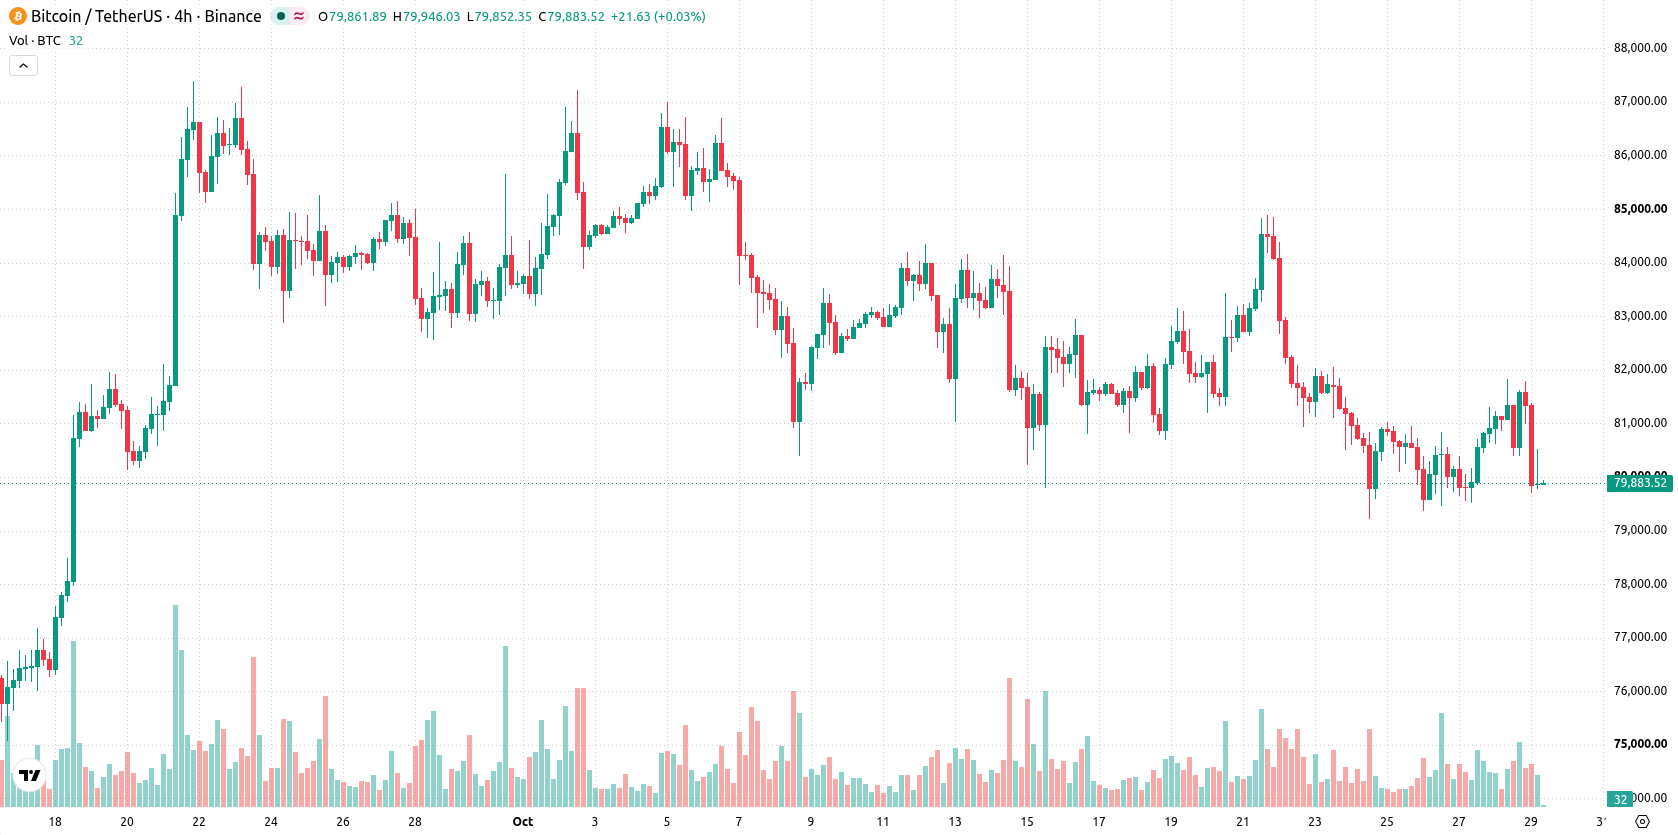
Bitcoin (BTC) is trading at $79,880, down 1.55% over the last session. The price has slipped below its key short- and medium-term moving averages but remains positioned above its long-term trend support.
 78878.01
81971.00
Highlights
- The US Federal Reserve kept its benchmark rate unchanged at 3.75% to 4%, maintaining current liquidity and funding conditions.
- No new macro policy support emerged for alternative assets like Bitcoin, limiting demand and fresh capital allocation.
- BTC/USD trades below key short and medium-term moving averages, with a projected range of $76,284 to $81,150 and a 78% probability of further decline.
Muted bitcoin demand as Fed rate hold limits new macro tailwinds
The US Federal Reserve maintained its benchmark interest rate at 3.75%–4.00%, a decision that preserves the prevailing liquidity environment and funding costs in US dollar markets. This status quo can impact demand for alternative assets like Bitcoin by shaping risk appetite and capital allocation, according to Crypto Economy, Coinpedia, and Unchainedcrypto. With monetary policy on hold, there are no new macro tailwinds, which may have limited fresh buying interest amid recent moves.
Mixed momentum signals as price nears key resistance and volatility rises
On the H4 chart, BTC is trading below the MA-20 at $80,539 and the MA-50 at $81,279, while remaining above the daily MA-200 at $73,111. The Ichimoku Kijun level at $80,595 presents immediate resistance. Momentum signals are mixed: ADX and RSI reflect underlying buyer strength, which is also supported by CCI and the Awesome Oscillator, but MACD and Stochastic RSI are neutral. Bull/Bear Power is flagged as overbought, indicating recent dominance by buyers, though the negative divergence with today’s bearish price action highlights emerging short-term selling pressure and moderate volatility.
Downside potential dominates as breakout odds remain subdued
Over the coming days, BTC is likely to trade within a volatility band of $76,284 to $81,150. The probability of an upside breakout is presently assessed at 22%, while there is a 78% chance of further decline, suggesting a lower likelihood of immediate reversal. The baseline scenario anticipates rangebound movement in this corridor; an upward scenario would require a sustained push above $80,595, whereas renewed selling momentum could drive prices below $76,284 support.
Earlier, analysts noted that Bitcoin’s short-term direction was constrained by oversold technical conditions and a stall in institutional accumulation. The current technical setup adds nuance, as mixed momentum indicators now suggest traders should closely monitor the $76,284 support level for any signs of renewed downside risk in the near term.











-
 Afghanistan
-
 Albania
-
 Algeria
-
 Angola
-
 Argentina
-
 Armenia
-
 Australia
-
 Austria
-
 Azerbaijan
-
 Bahamas
-
 Bahrain
-
 Bangladesh
-
 Belarus
-
 Belgium
-
 Bolivia
-
 Botswana
-
 Brazil
-
 Brunei
-
 Bulgaria
-
 Cambodia
-
 Cameroon
-
 Canada
-
 Chile
-
 China
-
 Colombia
-
 Congo
-
 Costa Rica
-
 Cote d'Ivoire
-
 Croatia
-
 Cuba
-
 Cyprus
-
 Czechia
-
 DR Congo
-
 Denmark
-
 Dominican Republic
-
 Ecuador
-
 Egypt
-
 El Salvador
-
 Estonia
-
 Eswatini
-
 Ethiopia
-
 Finland
-
 France
-
 Georgia
-
 Germany
-
 Ghana
-
 Greece
-
 Haiti
-
 Hong Kong
-
 Hungary
-
 India
-
 Indonesia
-
 Iran, Islamic republic
-
 Iraq
-
 Ireland
-
 Israel
-
 Italy
-
 Jamaica
-
 Japan
-
 Jordan
-
 Kazakhstan
-
 Kenya
-
 Korea
-
 Kuwait
-
 Kyrgyzstan
-
 Laos
-
 Latvia
-
 Lebanon
-
 Lesotho
-
 Libya
-
 Lithuania
-
 Luxembourg
-
 Madagascar
-
 Malaysia
-
 Malta
-
 Mauritius
-
 Mexico
-
 Moldova
-
 Mongolia
-
 Montenegro
-
 Morocco
-
 Mozambique
-
 Myanmar
-
 Namibia
-
 Nepal
-
 Netherlands
-
 New Zealand
-
 Nigeria
-
 North Macedonia
-
 Norway
-
 Oman
-
 Pakistan
-
 Palestine
-
 Panama
-
 Papua New Guinea
-
 Paraguay
-
 Peru
-
 Philippines
-
 Poland
-
 Portugal
-
 Puerto Rico
-
 Qatar
-
 Reunion
-
 Romania
-
 Rwanda
-
 Saudi Arabia
-
 Serbia
-
 Singapore
-
 Slovakia
-
 Slovenia
-
 Somalia
-
 South Africa
-
 Spain
-
 Sri Lanka
-
 Sweden
-
 Switzerland
-
 Syria
-
 Taiwan
-
 Tajikistan
-
 Tanzania
-
 Thailand
-
 Trinidad and Tobago
-
 Tunisia
-
 Turkey
-
 UAE
-
 Uganda
-
 Ukraine
-
 United Kingdom
-
United States
-
 Uruguay
-
 Uzbekistan
-
 Venezuela
-
 Vietnam
-
 Yemen
-
 Zambia
-
 Zimbabwe
- Forex
- Crypto












