

Optimism technical analysis: Downward momentum confirmed below $0.0999 support

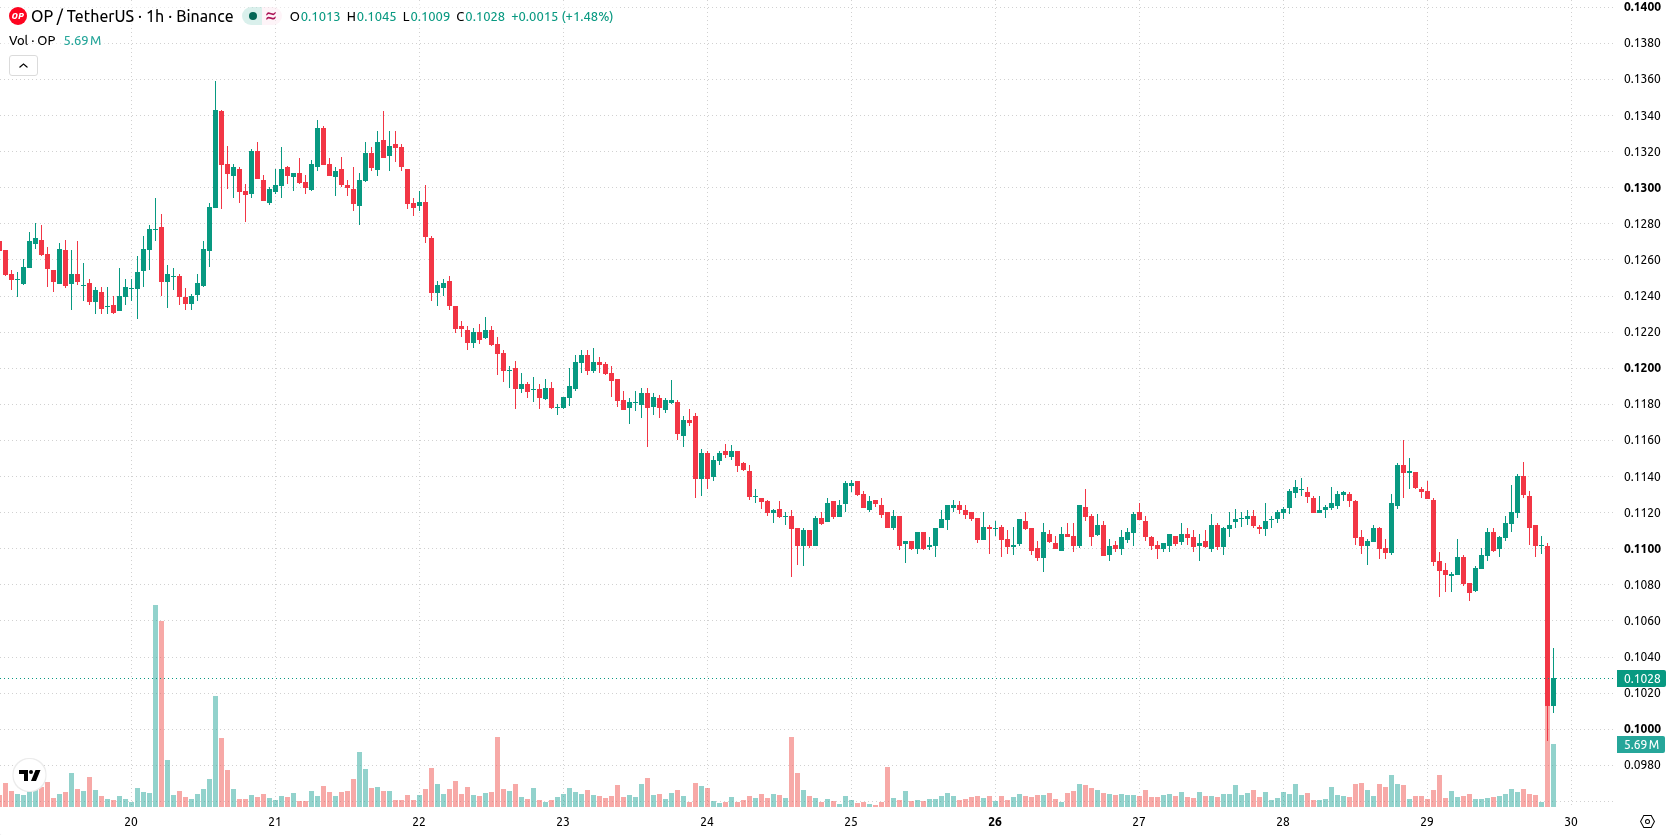
Optimism (OP) is trading at $0.1037, down 8.96% for the session. The asset currently trades below its key moving averages, reflecting persistent downward momentum.
 0.1103
0.1228
Highlights
- The Optimism Foundation proposes Ether fee refunds to certain OP Mainnet partners, reducing revenue for the protocol's OP token buyback program.
- Diverting funds from buybacks may lower market price support for OP and increase vulnerability to selling pressure.
- OP/USD trades below major moving averages with predominant bearish technical signals, projected to fluctuate between $0.0999 to $0.1065 over the next 2 to 3 days.
Buyback support weakened as protocol shifts Ether fee incentives
The Optimism Foundation has proposed distributing Ether fee refunds to certain OP Mainnet partners, a plan that would decrease the protocol's net revenue channeled into its 50% OP token buyback, according to Coinotag. By reducing the allocation for buybacks, this move could lower structural support for OP's market price, making the asset more vulnerable to selling pressure. The proposed adjustment signals a shift in protocol incentives that may contribute to the current market backdrop.
Multiple sell signals as momentum indicators turn increasingly bearish
On the technical front, OP is trading below the MA-20 at $0.11, the MA-50 at $0.1114, and the MA-200 at $0.1124, with the Ichimoku Kijun positioned at $0.1116 serving as the immediate resistance level. Momentum indicators present a bearish outlook: MACD prints a Sell signal, while ADX remains Neutral and does not indicate strong trend strength. RSI stands at 40.5 and, along with CCI, both signal Sell, highlighting continued downside pressure. Stochastic RSI is Neutral and the Awesome Oscillator is also Neutral, reflecting a lack of strong short-term conviction. Bull/Bear Power confirms sellers dominate the intraday momentum.
Sideways outlook persists unless price breaches key support or resistance
For the coming 2-3 trading days, OP is expected to fluctuate within the $0.0999 to $0.1065 range, representing the typical volatility band relative to current levels. The baseline scenario is for sideways movement within this band. A bullish breakout scenario would require a move above $0.1116, opening potential for a test of higher resistance. Conversely, a drop below $0.0999 could accelerate declines toward new local lows.
Earlier, analysts noted that Optimism faced continued downside risk, with technical indicators highlighting persistent seller dominance. The latest developments reinforce this bearish outlook, as reduced buyback support and confirmed negative momentum place heightened attention on the $0.0999 level as a pivotal threshold for further downside movement.









-
 Afghanistan
-
 Albania
-
 Algeria
-
 Angola
-
 Argentina
-
 Armenia
-
 Australia
-
 Austria
-
 Azerbaijan
-
 Bahamas
-
 Bahrain
-
 Bangladesh
-
 Belarus
-
 Belgium
-
 Bolivia
-
 Botswana
-
 Brazil
-
 Brunei
-
 Bulgaria
-
 Cambodia
-
 Cameroon
-
 Canada
-
 Chile
-
 China
-
 Colombia
-
 Congo
-
 Costa Rica
-
 Cote d'Ivoire
-
 Croatia
-
 Cuba
-
 Cyprus
-
 Czechia
-
 DR Congo
-
 Denmark
-
 Dominican Republic
-
 Ecuador
-
 Egypt
-
 El Salvador
-
 Estonia
-
 Eswatini
-
 Ethiopia
-
 Finland
-
 France
-
 Georgia
-
 Germany
-
 Ghana
-
 Greece
-
 Haiti
-
 Hong Kong
-
 Hungary
-
 India
-
 Indonesia
-
 Iran, Islamic republic
-
 Iraq
-
 Ireland
-
 Israel
-
 Italy
-
 Jamaica
-
 Japan
-
 Jordan
-
 Kazakhstan
-
 Kenya
-
 Korea
-
 Kuwait
-
 Kyrgyzstan
-
 Laos
-
 Latvia
-
 Lebanon
-
 Lesotho
-
 Libya
-
 Lithuania
-
 Luxembourg
-
 Madagascar
-
 Malaysia
-
 Malta
-
 Mauritius
-
 Mexico
-
 Moldova
-
 Mongolia
-
 Montenegro
-
 Morocco
-
 Mozambique
-
 Myanmar
-
 Namibia
-
 Nepal
-
 Netherlands
-
 New Zealand
-
 Nigeria
-
 North Macedonia
-
 Norway
-
 Oman
-
 Pakistan
-
 Palestine
-
 Panama
-
 Papua New Guinea
-
 Paraguay
-
 Peru
-
 Philippines
-
 Poland
-
 Portugal
-
 Puerto Rico
-
 Qatar
-
 Reunion
-
 Romania
-
 Rwanda
-
 Saudi Arabia
-
 Serbia
-
 Singapore
-
 Slovakia
-
 Slovenia
-
 Somalia
-
 South Africa
-
 Spain
-
 Sri Lanka
-
 Sweden
-
 Switzerland
-
 Syria
-
 Taiwan
-
 Tajikistan
-
 Tanzania
-
 Thailand
-
 Trinidad and Tobago
-
 Tunisia
-
 Turkey
-
 UAE
-
 Uganda
-
 Ukraine
-
 United Kingdom
-
United States
-
 Uruguay
-
 Uzbekistan
-
 Venezuela
-
 Vietnam
-
 Yemen
-
 Zambia
-
 Zimbabwe
- Forex
- Crypto












