

What's behind Fetch.ai's latest 10.7% price pullback?

Fetch.ai (FET) extended its decline, falling 10.7% as intraday momentum remained firmly negative and technical selling pressure accelerated across all timeframes. The move is supported by the token's position well below its 20-day, 50-day, and 200-day moving averages, with sustained selling momentum and no fresh catalysts to offset the weak structure.
 0.126
0.1492
Highlights
- FET/USD trades below major moving averages with sustained intraday downside, dropping 10.7% to $0.1644 and testing session lows.
- Momentum and oscillator indicators confirm seller dominance and a weak, non-trending environment across all timeframes.
- The baseline scenario sets an expected five-day range of $0.1493 to $0.1744 with a 75% probability of a downward move.
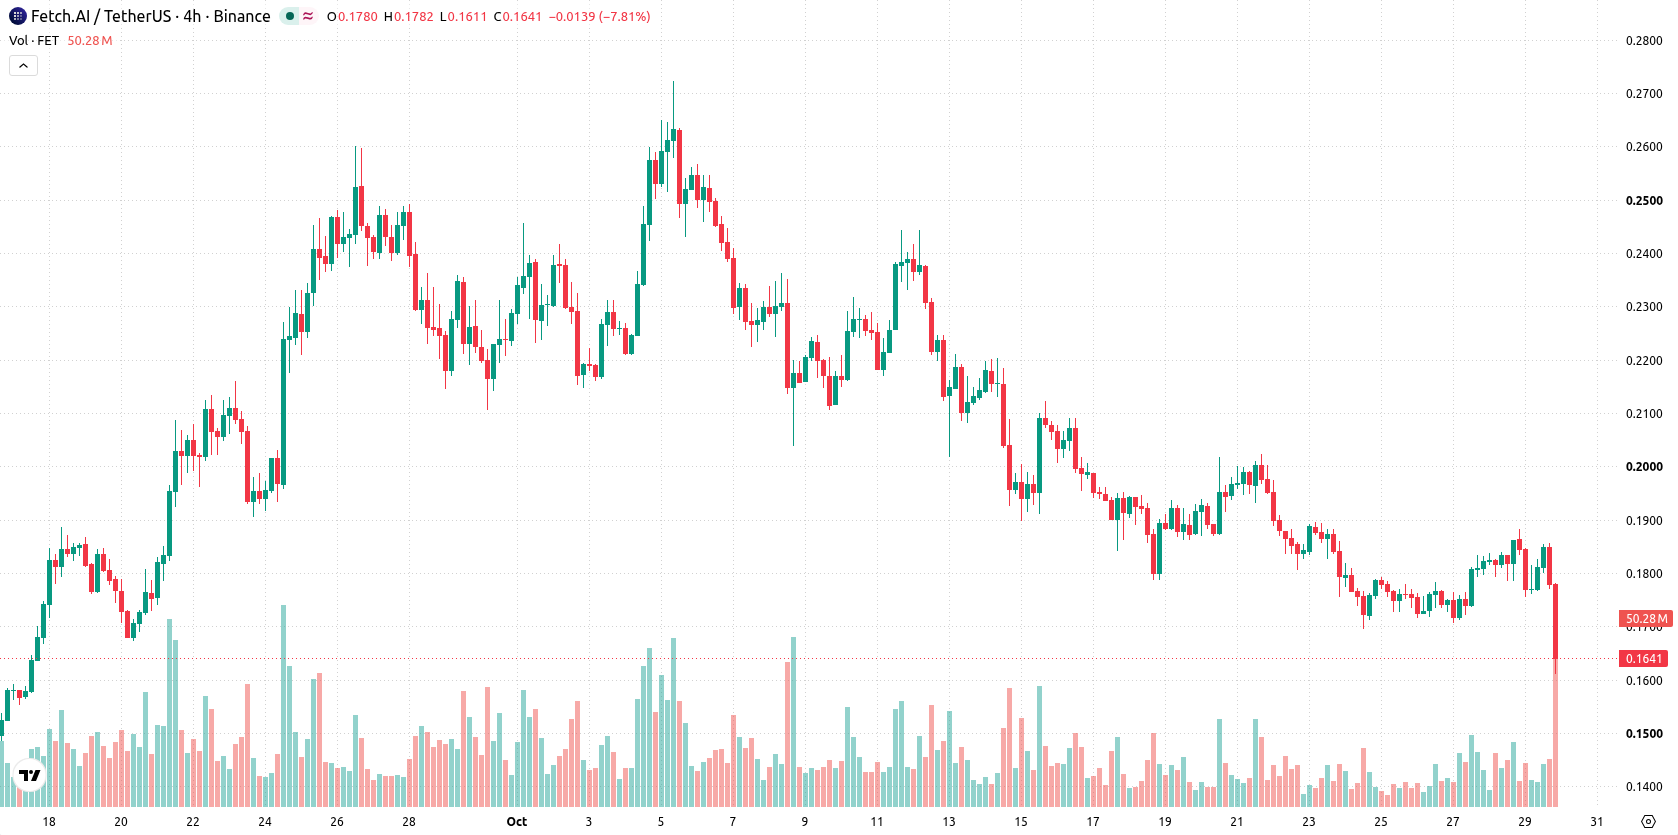
Persistent downside as sellers dominate below key technical thresholds
FET/USD is trading below its 20-day, 50-day, and 200-day moving averages at $0.1969, $0.2014, and $0.1882 respectively, placing current price action under notable pressure from sellers across all timeframes. The Ichimoku Kijun at $0.2209 acts as overhead resistance, and the bullish alignment between the 50-day and 200-day averages signals that the longer-term trend remains constructive even as price struggles in the short term. Immediate levels to watch are the near-term ceiling at $0.1695 and the floor at $0.1493. Short-term momentum for FET/USD is showing persistent weakness, with the Moving Average Convergence Divergence (MACD) and Commodity Channel Index (CCI) both giving sell signals, and the Average Directional Index (ADX) signaling a non-trending environment. The Relative Strength Index (RSI) is at 44.65 pointing to weak momentum, with sellers dominating intraday according to the Bull/Bear Power (BBP) signal. Daily performance is negative, with the price at $0.1644, dropping $0.0197 or 10.7%. The pair opened with a small upside gap of approximately 0.16%, and is now trading near the session low. Intraday volatility stands at 5.87%. There is sustained downside pressure after the open. Oscillators and momentum indicators are largely in agreement with the intraday move, reinforcing the prevailing negative tone.
Earlier, analysts noted that Fetch.ai was experiencing persistent selling pressure and a bearish technical outlook. The current article reinforces this negative momentum with deepening downside risks, highlighting $0.1493 as a critical support level for traders to monitor in the days ahead.










-
 Afghanistan
-
 Albania
-
 Algeria
-
 Angola
-
 Argentina
-
 Armenia
-
 Australia
-
 Austria
-
 Azerbaijan
-
 Bahamas
-
 Bahrain
-
 Bangladesh
-
 Belarus
-
 Belgium
-
 Bolivia
-
 Botswana
-
 Brazil
-
 Brunei
-
 Bulgaria
-
 Cambodia
-
 Cameroon
-
 Canada
-
 Chile
-
 China
-
 Colombia
-
 Congo
-
 Costa Rica
-
 Cote d'Ivoire
-
 Croatia
-
 Cuba
-
 Cyprus
-
 Czechia
-
 DR Congo
-
 Denmark
-
 Dominican Republic
-
 Ecuador
-
 Egypt
-
 El Salvador
-
 Estonia
-
 Eswatini
-
 Ethiopia
-
 Finland
-
 France
-
 Georgia
-
 Germany
-
 Ghana
-
 Greece
-
 Haiti
-
 Hong Kong
-
 Hungary
-
 India
-
 Indonesia
-
 Iran, Islamic republic
-
 Iraq
-
 Ireland
-
 Israel
-
 Italy
-
 Jamaica
-
 Japan
-
 Jordan
-
 Kazakhstan
-
 Kenya
-
 Korea
-
 Kuwait
-
 Kyrgyzstan
-
 Laos
-
 Latvia
-
 Lebanon
-
 Lesotho
-
 Libya
-
 Lithuania
-
 Luxembourg
-
 Madagascar
-
 Malaysia
-
 Malta
-
 Mauritius
-
 Mexico
-
 Moldova
-
 Mongolia
-
 Montenegro
-
 Morocco
-
 Mozambique
-
 Myanmar
-
 Namibia
-
 Nepal
-
 Netherlands
-
 New Zealand
-
 Nigeria
-
 North Macedonia
-
 Norway
-
 Oman
-
 Pakistan
-
 Palestine
-
 Panama
-
 Papua New Guinea
-
 Paraguay
-
 Peru
-
 Philippines
-
 Poland
-
 Portugal
-
 Puerto Rico
-
 Qatar
-
 Reunion
-
 Romania
-
 Rwanda
-
 Saudi Arabia
-
 Serbia
-
 Singapore
-
 Slovakia
-
 Slovenia
-
 Somalia
-
 South Africa
-
 Spain
-
 Sri Lanka
-
 Sweden
-
 Switzerland
-
 Syria
-
 Taiwan
-
 Tajikistan
-
 Tanzania
-
 Thailand
-
 Trinidad and Tobago
-
 Tunisia
-
 Turkey
-
 UAE
-
 Uganda
-
 Ukraine
-
 United Kingdom
-
United States
-
 Uruguay
-
 Uzbekistan
-
 Venezuela
-
 Vietnam
-
 Yemen
-
 Zambia
-
 Zimbabwe
- Forex
- Crypto












