

Solana stalls below $103.85 resistance as technical indicators remain negative: weekly outlook

Solana (SOL) is trading near $97 after falling nearly 7% over the past week, pressured by notable ETF outflows. As negative fund flows weigh on sentiment and the token enters oversold territory, investors are watching for signs of stabilization or a potential rebound in the days ahead.
 95.95
103.85
Highlights
- Solana trades at $96.88 after a 6.85% decline over the past 7 days, with structure weakening.
- Downside momentum persists as trend signals turn negative, although momentum oscillators indicate oversold conditions and volatility has risen to 9.32%.
- Solana is projected to stay within a $92.19 to $101.56 range over the next week, with 79% probability of further decline and $95 as key support.
Largest single-day ETF outflows of the year deepen October losses amid institutional moves
ETF outflows weighed heavily on SOL as US-listed spot Solana products saw about $24.8 million withdrawn between October 27 and 28, 2026, according to coinpaper.com. This withdrawal, confirmed by beincrypto.com, marked the largest single-day ETF outflow since December 2025 and contributed to deepening October losses. Despite these outflows, institutional activity persisted with J.P. Morgan Asset Management launching tokenized money market funds on Solana and Polygon Labs integrating SOL into its stablecoin banking stack (sources: 247wallst.com, coinreporter.io).
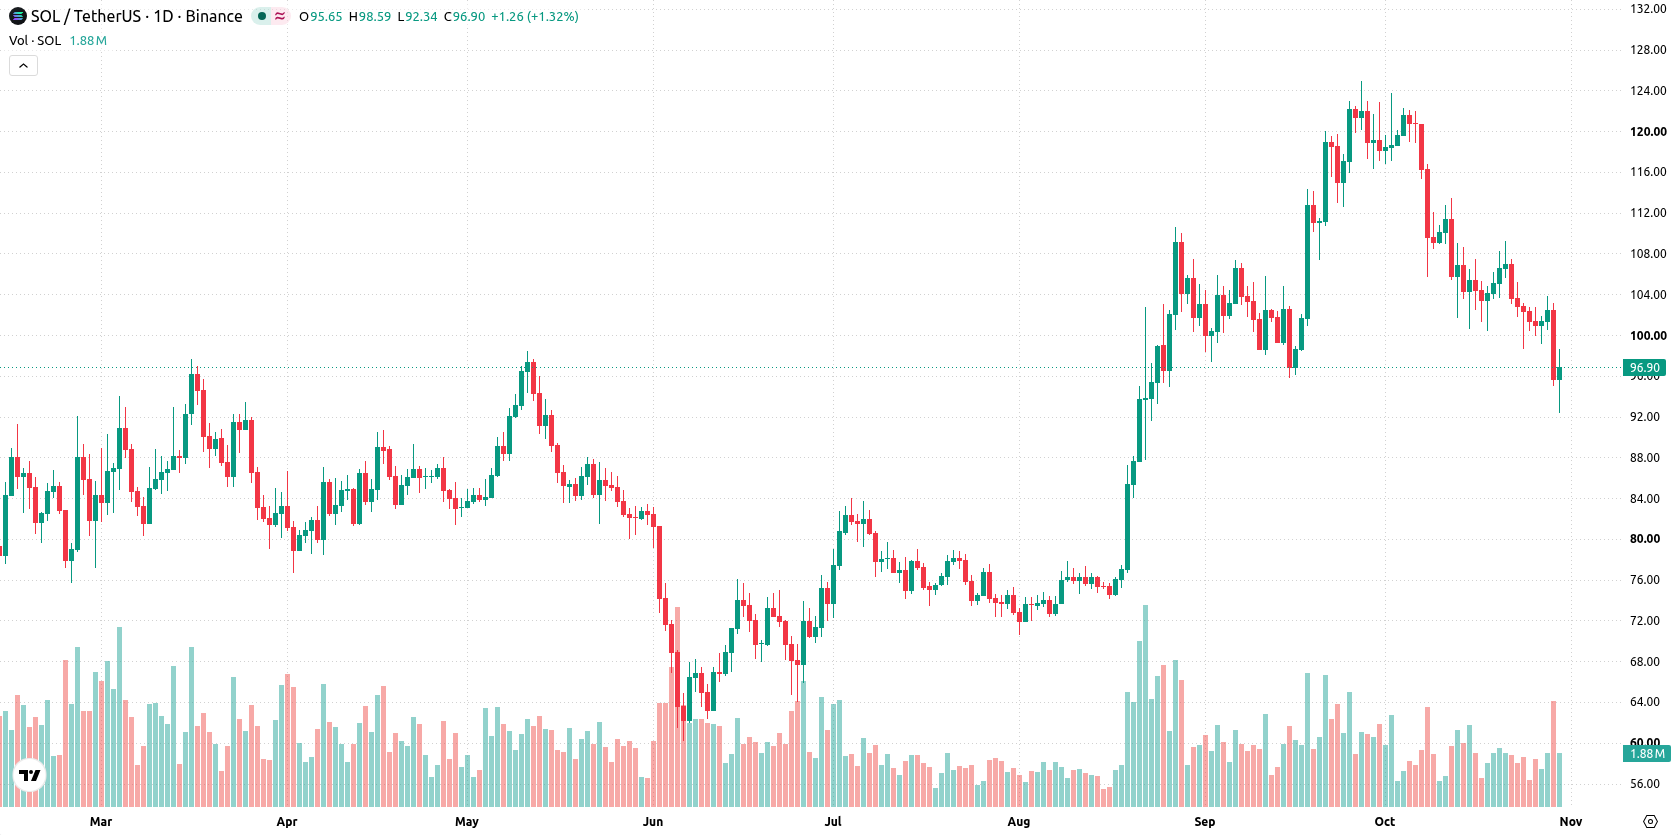
Downside persists as technical indicators highlight elevated volatility and oversold conditions
On the daily chart, Solana continues its sustained move lower with a firm trend, as MACD and ADX both signal ongoing downside momentum. Momentum oscillators show CCI and Stochastic RSI in oversold territory, suggesting that selling pressure may be overextended, while RSI remains neutral at 33.95. Key levels to watch are support at $95 and resistance at $103.85, with the Ichimoku Kijun at $110.36 marking an additional resistance barrier. Volatility has been elevated at 9.32%, underlining the force of the recent decline.
Downside bias remains next week unless price reclaims key resistance
Over the next 7 days, Solana is expected to trade in a $92.19 to $101.56 range, with a 21% probability of an increase and a 79% probability of further decline. The base case is continued pressure below $103.85, while a decisive break above this resistance would suggest a short-term recovery. If price falls below $95 support, selling could accelerate toward the lower end of the expected range.
Earlier, analysts noted that persistent ETF outflows and security concerns outweighed positive structural developments for Solana, resulting in consolidation and downside risk. The current article strengthens this view with evidence of continued fund withdrawals and pressure, highlighting $95 as a critical support level that may determine the near-term direction for SOL.











-
 Afghanistan
-
 Albania
-
 Algeria
-
 Angola
-
 Argentina
-
 Armenia
-
 Australia
-
 Austria
-
 Azerbaijan
-
 Bahamas
-
 Bahrain
-
 Bangladesh
-
 Belarus
-
 Belgium
-
 Bolivia
-
 Botswana
-
 Brazil
-
 Brunei
-
 Bulgaria
-
 Cambodia
-
 Cameroon
-
 Canada
-
 Chile
-
 China
-
 Colombia
-
 Congo
-
 Costa Rica
-
 Cote d'Ivoire
-
 Croatia
-
 Cuba
-
 Cyprus
-
 Czechia
-
 DR Congo
-
 Denmark
-
 Dominican Republic
-
 Ecuador
-
 Egypt
-
 El Salvador
-
 Estonia
-
 Eswatini
-
 Ethiopia
-
 Finland
-
 France
-
 Georgia
-
 Germany
-
 Ghana
-
 Greece
-
 Haiti
-
 Hong Kong
-
 Hungary
-
 India
-
 Indonesia
-
 Iran, Islamic republic
-
 Iraq
-
 Ireland
-
 Israel
-
 Italy
-
 Jamaica
-
 Japan
-
 Jordan
-
 Kazakhstan
-
 Kenya
-
 Korea
-
 Kuwait
-
 Kyrgyzstan
-
 Laos
-
 Latvia
-
 Lebanon
-
 Lesotho
-
 Libya
-
 Lithuania
-
 Luxembourg
-
 Madagascar
-
 Malaysia
-
 Malta
-
 Mauritius
-
 Mexico
-
 Moldova
-
 Mongolia
-
 Montenegro
-
 Morocco
-
 Mozambique
-
 Myanmar
-
 Namibia
-
 Nepal
-
 Netherlands
-
 New Zealand
-
 Nigeria
-
 North Macedonia
-
 Norway
-
 Oman
-
 Pakistan
-
 Palestine
-
 Panama
-
 Papua New Guinea
-
 Paraguay
-
 Peru
-
 Philippines
-
 Poland
-
 Portugal
-
 Puerto Rico
-
 Qatar
-
 Reunion
-
 Romania
-
 Rwanda
-
 Saudi Arabia
-
 Serbia
-
 Singapore
-
 Slovakia
-
 Slovenia
-
 Somalia
-
 South Africa
-
 Spain
-
 Sri Lanka
-
 Sweden
-
 Switzerland
-
 Syria
-
 Taiwan
-
 Tajikistan
-
 Tanzania
-
 Thailand
-
 Trinidad and Tobago
-
 Tunisia
-
 Turkey
-
 UAE
-
 Uganda
-
 Ukraine
-
 United Kingdom
-
United States
-
 Uruguay
-
 Uzbekistan
-
 Venezuela
-
 Vietnam
-
 Yemen
-
 Zambia
-
 Zimbabwe
- Forex
- Crypto












