

XTZ slips as seller pressure dominates the crypto's short-term trend

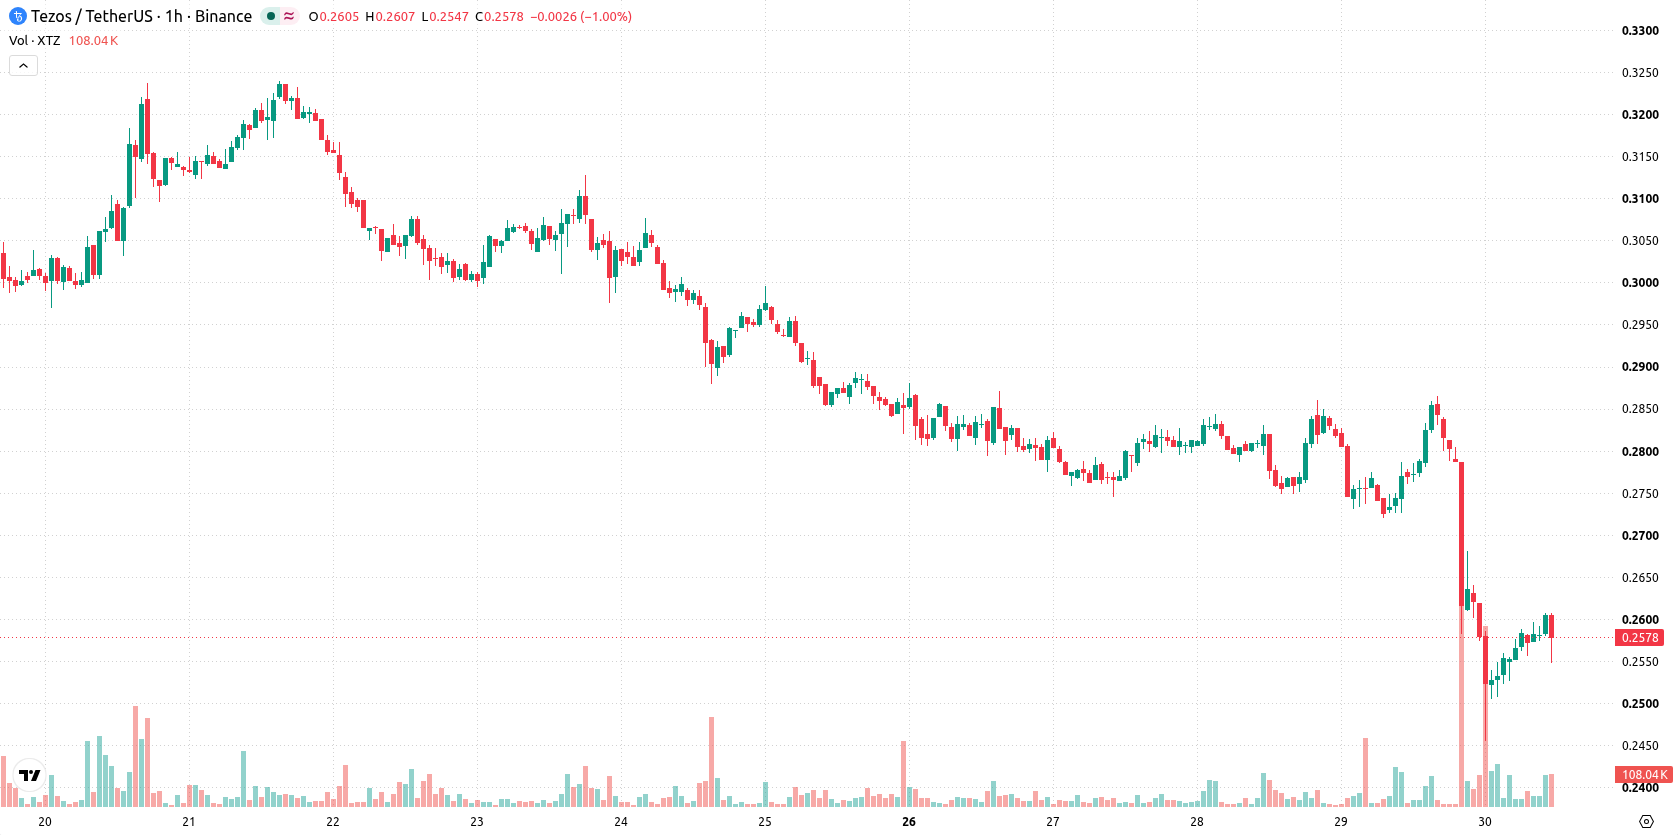
Tezos (XTZ) is trading at $0.2579, posting a 7% decline for the day. The asset currently sits below its key short- and long-term moving averages.
 0.2583
0.28800000
Highlights
- XTZ/USD trades below major moving averages with strong selling pressure across short, medium, and long-term timeframes.
- Bearish momentum prevails as most indicators point to a sell environment, with intraday volatility elevated and price recently down 7%.
- XTZ/USD is projected to fluctuate between $0.24663022 and $0.26916978 in the next 2 to 3 days, with 74% probability of a downside move.
Negative momentum persists as intraday pressures override mixed signals
On the technical front, XTZ/USD is trading below the MA-20 and MA-50 on the hourly chart, and also remains under the MA-200 on the daily timeframe. The Ichimoku Kijun level at $0.26595 is acting as immediate resistance. Among indicators, the MACD is on Strong Sell, ADX indicates a Sell environment, and Bull/Bear Power confirms sellers currently dominate intraday. RSI is at 37.99, reflecting continued weakness but not outright oversold conditions, while Stoch RSI is already Overbought and CCI is Neutral. The Awesome Oscillator does not confirm an established trend at present, and the intraday price gap down aligns with the generally negative momentum, though some divergence exists as Stoch RSI signals overbought.
Downside bias prevails as volatility shapes near-term outlook
Over the next 2–3 trading days, XTZ/USD is likely to fluctuate within a volatility band between $0.24663022 and $0.26916978. The probability of an upward move is estimated at 26%, with a 74% chance of further downside, so the baseline scenario is for price to hold within this corridor. If bullish momentum emerges and price breaks above $0.26595, a move to the upper end of the range could follow. Alternatively, a breach below the lower end would suggest additional selling and a potential trend extension lower.
Earlier, analysts noted that Tezos was showing mixed-to-bullish momentum as buyers dominated near technical support. The recent shift below key moving averages and the emergence of stronger downside signals highlight a change in trend, with traders advised to watch the $0.24663022 support as a key risk level for further declines.











-
 Afghanistan
-
 Albania
-
 Algeria
-
 Angola
-
 Argentina
-
 Armenia
-
 Australia
-
 Austria
-
 Azerbaijan
-
 Bahamas
-
 Bahrain
-
 Bangladesh
-
 Belarus
-
 Belgium
-
 Bolivia
-
 Botswana
-
 Brazil
-
 Brunei
-
 Bulgaria
-
 Cambodia
-
 Cameroon
-
 Canada
-
 Chile
-
 China
-
 Colombia
-
 Congo
-
 Costa Rica
-
 Cote d'Ivoire
-
 Croatia
-
 Cuba
-
 Cyprus
-
 Czechia
-
 DR Congo
-
 Denmark
-
 Dominican Republic
-
 Ecuador
-
 Egypt
-
 El Salvador
-
 Estonia
-
 Eswatini
-
 Ethiopia
-
 Finland
-
 France
-
 Georgia
-
 Germany
-
 Ghana
-
 Greece
-
 Haiti
-
 Hong Kong
-
 Hungary
-
 India
-
 Indonesia
-
 Iran, Islamic republic
-
 Iraq
-
 Ireland
-
 Israel
-
 Italy
-
 Jamaica
-
 Japan
-
 Jordan
-
 Kazakhstan
-
 Kenya
-
 Korea
-
 Kuwait
-
 Kyrgyzstan
-
 Laos
-
 Latvia
-
 Lebanon
-
 Lesotho
-
 Libya
-
 Lithuania
-
 Luxembourg
-
 Madagascar
-
 Malaysia
-
 Malta
-
 Mauritius
-
 Mexico
-
 Moldova
-
 Mongolia
-
 Montenegro
-
 Morocco
-
 Mozambique
-
 Myanmar
-
 Namibia
-
 Nepal
-
 Netherlands
-
 New Zealand
-
 Nigeria
-
 North Macedonia
-
 Norway
-
 Oman
-
 Pakistan
-
 Palestine
-
 Panama
-
 Papua New Guinea
-
 Paraguay
-
 Peru
-
 Philippines
-
 Poland
-
 Portugal
-
 Puerto Rico
-
 Qatar
-
 Reunion
-
 Romania
-
 Rwanda
-
 Saudi Arabia
-
 Serbia
-
 Singapore
-
 Slovakia
-
 Slovenia
-
 Somalia
-
 South Africa
-
 Spain
-
 Sri Lanka
-
 Sweden
-
 Switzerland
-
 Syria
-
 Taiwan
-
 Tajikistan
-
 Tanzania
-
 Thailand
-
 Trinidad and Tobago
-
 Tunisia
-
 Turkey
-
 UAE
-
 Uganda
-
 Ukraine
-
 United Kingdom
-
United States
-
 Uruguay
-
 Uzbekistan
-
 Venezuela
-
 Vietnam
-
 Yemen
-
 Zambia
-
 Zimbabwe
- Forex
- Crypto












