

Hedera weekly forecast: Oversold signals put support in focus

Hedera (HBAR) is trading near $0.072 after a drop of about 9% this week as support levels come into focus following an extended decline. Ongoing regulatory developments and infrastructure advances will be key factors to watch as the market assesses whether recent selling has reached exhaustion.
 0.0724
0.0781
Highlights
- Hedera trades at $0.072 after falling 9.38% over the past week, positioned below key moving averages.
- The daily chart maintains a bearish structure with 19.24% volatility and momentum indicators confirming oversold conditions.
- Price is expected to move within a $0.0652 to $0.0806 range, with support at $0.066 and resistance at $0.0787.
Protocol push for SEC clarity and ETF interest shape flows this week
Hedera joined several digital asset firms in submitting a letter to the U.S. Securities and Exchange Commission on October 20, 2026, seeking clearer regulation and fairer classification for protocols like HBAR, according to en.coin-turk.com. Meanwhile, Bron has joined The Hashgraph Association's Global Membership Program, expanding HBAR custody options as reported by PR Newswire. A new spot ETF referencing HBAR is also drawing attention for its potential to expand institutional access, though recent inflows remain modest.
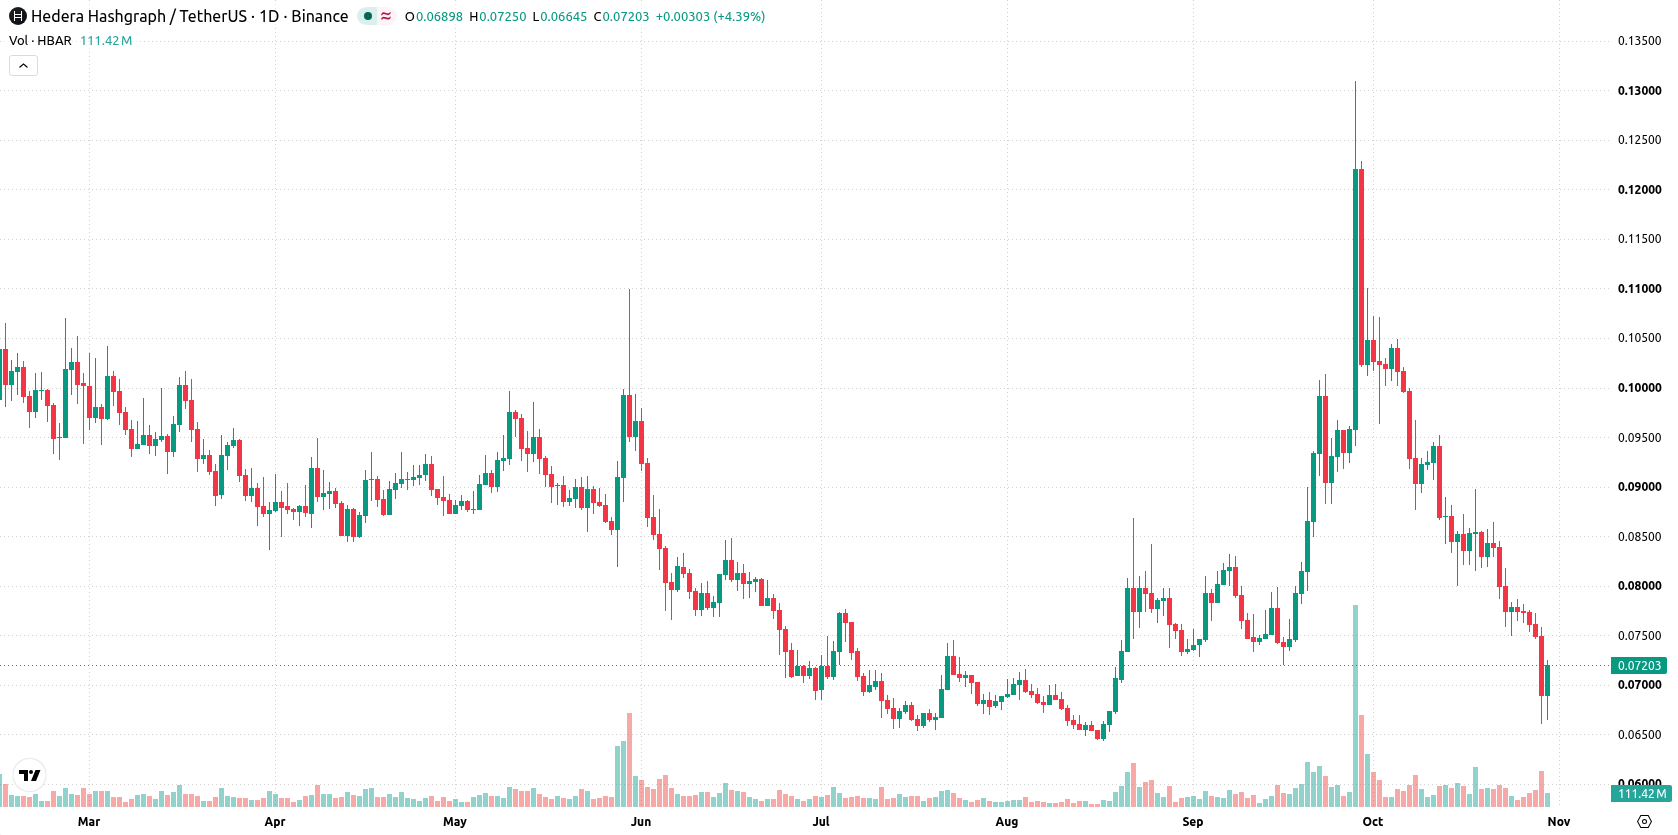
Bearish signals persist as oversold conditions and resistance limit upside
The daily chart shows a bearish structure as Hedera remains under pressure following a sharp move lower without a sustained trend, highlighted by 19.24% volatility. A confirmed oversold signal from Stochastic RSI and CCI points to possible selling exhaustion, while the MACD maintains a sell indication at -0.0056. The nearest support is seen at $0.066, with resistance capped at $0.0787 and additional resistance from the Ichimoku Kijun at $0.0887, suggesting upward attempts are likely to meet selling interest.
Downside bias dominates unless a breakout above resistance emerges
Over the coming week, the expected range is $0.0652 to $0.0806. There is a very high probability of a decrease and a very low probability of an increase. The base case calls for price action holding within the band set by $0.066 support and $0.0787 resistance. A move above $0.0787 would open the way for a test towards the upper end of the range, while a drop below $0.066 would point to further downside pressure.
Earlier, analysts noted that Hedera remained under persistent downside pressure as technical indicators and price action signaled ongoing bearish momentum. The current article adds the impact of regulatory engagement and expanding custody infrastructure, with traders now monitoring the $0.066 support and $0.0787 resistance as pivotal levels for near-term direction.






Latest HBAR News




-
 Afghanistan
-
 Albania
-
 Algeria
-
 Angola
-
 Argentina
-
 Armenia
-
 Australia
-
 Austria
-
 Azerbaijan
-
 Bahamas
-
 Bahrain
-
 Bangladesh
-
 Belarus
-
 Belgium
-
 Bolivia
-
 Botswana
-
 Brazil
-
 Brunei
-
 Bulgaria
-
 Cambodia
-
 Cameroon
-
 Canada
-
 Chile
-
 China
-
 Colombia
-
 Congo
-
 Costa Rica
-
 Cote d'Ivoire
-
 Croatia
-
 Cuba
-
 Cyprus
-
 Czechia
-
 DR Congo
-
 Denmark
-
 Dominican Republic
-
 Ecuador
-
 Egypt
-
 El Salvador
-
 Estonia
-
 Eswatini
-
 Ethiopia
-
 Finland
-
 France
-
 Georgia
-
 Germany
-
 Ghana
-
 Greece
-
 Haiti
-
 Hong Kong
-
 Hungary
-
 India
-
 Indonesia
-
 Iran, Islamic republic
-
 Iraq
-
 Ireland
-
 Israel
-
 Italy
-
 Jamaica
-
 Japan
-
 Jordan
-
 Kazakhstan
-
 Kenya
-
 Korea
-
 Kuwait
-
 Kyrgyzstan
-
 Laos
-
 Latvia
-
 Lebanon
-
 Lesotho
-
 Libya
-
 Lithuania
-
 Luxembourg
-
 Madagascar
-
 Malaysia
-
 Malta
-
 Mauritius
-
 Mexico
-
 Moldova
-
 Mongolia
-
 Montenegro
-
 Morocco
-
 Mozambique
-
 Myanmar
-
 Namibia
-
 Nepal
-
 Netherlands
-
 New Zealand
-
 Nigeria
-
 North Macedonia
-
 Norway
-
 Oman
-
 Pakistan
-
 Palestine
-
 Panama
-
 Papua New Guinea
-
 Paraguay
-
 Peru
-
 Philippines
-
 Poland
-
 Portugal
-
 Puerto Rico
-
 Qatar
-
 Reunion
-
 Romania
-
 Rwanda
-
 Saudi Arabia
-
 Serbia
-
 Singapore
-
 Slovakia
-
 Slovenia
-
 Somalia
-
 South Africa
-
 Spain
-
 Sri Lanka
-
 Sweden
-
 Switzerland
-
 Syria
-
 Taiwan
-
 Tajikistan
-
 Tanzania
-
 Thailand
-
 Trinidad and Tobago
-
 Tunisia
-
 Turkey
-
 UAE
-
 Uganda
-
 Ukraine
-
 United Kingdom
-
United States
-
 Uruguay
-
 Uzbekistan
-
 Venezuela
-
 Vietnam
-
 Yemen
-
 Zambia
-
 Zimbabwe
- Forex
- Crypto












