
Bitcoin price prediction: BTC dips to 3-week low as bearish structure intensifies

Bitcoin price has extended its losing streak into August after closing July on a four-day stretch of red candles.
The cryptocurrency began this week by rejecting the top resistance trendline of the bearish channel near $119,780, and yesterday, Thursday, marked the first daily close below the 20-day EMA since early July. That close came at $115,770, pulling bitcoin’s July performance back from a 13.88% gain at the high of $122,000 to just 8%.
- Bitcoin loses over 4% this week after closing below the 20-day EMA
- BTC 4hr RSI drops to oversold territory while price hits three-week low at $114,400
- 20 and 100 EMA cross on 4-hour chart signal deepening short-term bearish momentum
Thursday's session printed the highest daily volume of the week and confirmed a change in market character as RSI fell below the 50 mark into bearish territory for the first time in a month. The technical deterioration deepened overnight as the new month opened. In the Asian hours of Friday, bitcoin dropped 1.2% to a session low of $114,400. That level is the lowest price print in the last three weeks, further validating the lower-low structure inside the slightly descending channel.
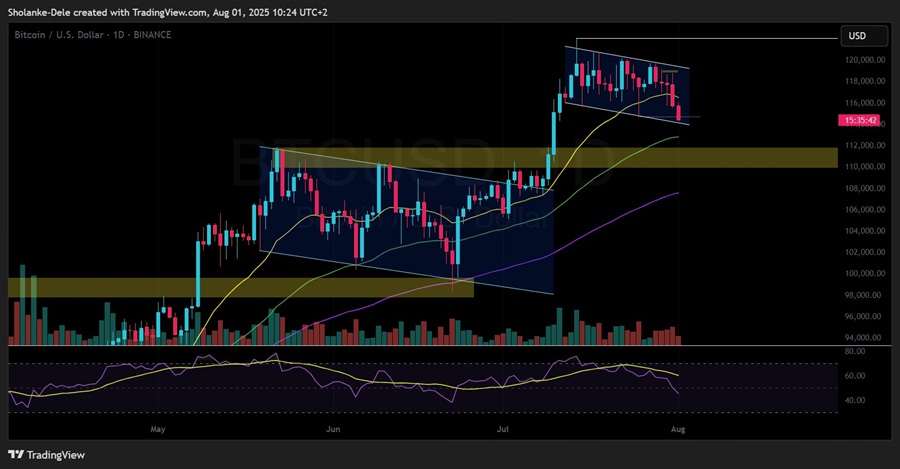
BTC price dynamics (June - July 2025). Source: TradingView
As of the European session, the price is still hovering around $114,400 and is on course to end the week with a loss of over 4%. The lower support trendline of the bearish channel lies just below this level at $114,200. If sellers manage to push below that zone, a larger breakdown may develop. RSI on the 4-hour chart has already crossed below the 30 threshold into oversold territory, a move that suggests short-term exhaustion but not necessarily a reversal yet.
Bitcoin 20 and 100 EMA cross on 4-hr chart confirms short-term bearish setup
More warning signs emerged on the 4-hour chart as the 20 EMA slid beneath the 100 EMA for the first time since late June, hinting at increasing short-term bearish momentum. If the price continues to drop through the base of the bearish channel, the 50-day EMA near $112,900 could serve as the next major support to monitor in the coming sessions.
Should a bounce occur from the lower boundary of the channel, the 20-day EMA around $116,600 will act as immediate resistance for any recovery attempt. For now, all indicators point to sustained weakness in the opening days of August unless a sharp intraday reversal disrupts this bearish trajectory.
Bitcoin price bounced as traders awaited the FOMC minutes and the White House Bitcoin reserve report. Bitcoin formed a Doji near $117,000 after rejecting the bearish channel’s resistance.


-
 Afghanistan
-
 Albania
-
 Algeria
-
 Angola
-
 Argentina
-
 Armenia
-
 Australia
-
 Austria
-
 Azerbaijan
-
 Bahamas
-
 Bahrain
-
 Bangladesh
-
 Belarus
-
 Belgium
-
 Bolivia
-
 Botswana
-
 Brazil
-
 Brunei
-
 Bulgaria
-
 Cambodia
-
 Cameroon
-
 Canada
-
 Chile
Chile
-
 China
China
-
 Colombia
-
 Congo
Congo
-
 Costa Rica
-
 Cote d'Ivoire
-
 Croatia
-
 Cuba
Cuba
-
 Cyprus
-
 Czechia
-
 DR Congo
-
 Denmark
-
 Dominican Republic
-
 Ecuador
-
 Egypt
Egypt
-
 El Salvador
-
 Estonia
-
 Eswatini
-
 Ethiopia
-
 Finland
-
 France
-
 Georgia
-
 Germany
-
 Ghana
Ghana
-
 Greece
-
 Haiti
Haiti
-
 Hong Kong
-
 Hungary
-
 India
India
-
 Indonesia
-
 Iran, Islamic republic
-
 Iraq
Iraq
-
 Ireland
-
 Israel
-
 Italy
Italy
-
 Jamaica
-
 Japan
Japan
-
 Jordan
-
 Kazakhstan
-
 Kenya
Kenya
-
 Korea
Korea
-
 Kuwait
-
 Kyrgyzstan
-
 Laos
Laos
-
 Latvia
-
 Lebanon
-
 Lesotho
-
 Libya
Libya
-
 Lithuania
-
 Luxembourg
-
 Madagascar
-
 Malaysia
-
 Malta
Malta
-
 Mauritius
-
 Mexico
-
 Moldova
-
 Mongolia
-
 Montenegro
-
 Morocco
-
 Mozambique
-
 Myanmar
-
 Namibia
-
 Nepal
Nepal
-
 Netherlands
-
 New Zealand
-
 Nigeria
-
 North Macedonia
-
 Norway
-
 Oman
Oman
-
 Pakistan
-
 Palestine
-
 Panama
-
 Papua New Guinea
-
 Paraguay
-
 Peru
Peru
-
 Philippines
-
 Poland
-
 Portugal
-
 Puerto Rico
-
 Qatar
Qatar
-
 Reunion
-
 Romania
-
 Rwanda
-
 Saudi Arabia
-
 Serbia
-
 Singapore
-
 Slovakia
-
 Slovenia
-
 Somalia
-
 South Africa
-
 Spain
Spain
-
 Sri Lanka
-
 Sweden
-
 Switzerland
-
 Syria
Syria
-
 Taiwan
-
 Tajikistan
-
 Tanzania
-
 Thailand
-
 Trinidad and Tobago
-
 Tunisia
-
 Turkey
-
 UAE
UAE
-
 Uganda
-
 Ukraine
-
 United Kingdom
-
United States
-
 Uruguay
-
 Uzbekistan
-
 Venezuela
-
 Vietnam
-
 Yemen
Yemen
-
 Zambia
-
 Zimbabwe
- Forex
- Crypto
