

Raydium extends decline while downward price move is confirmed by technical signals

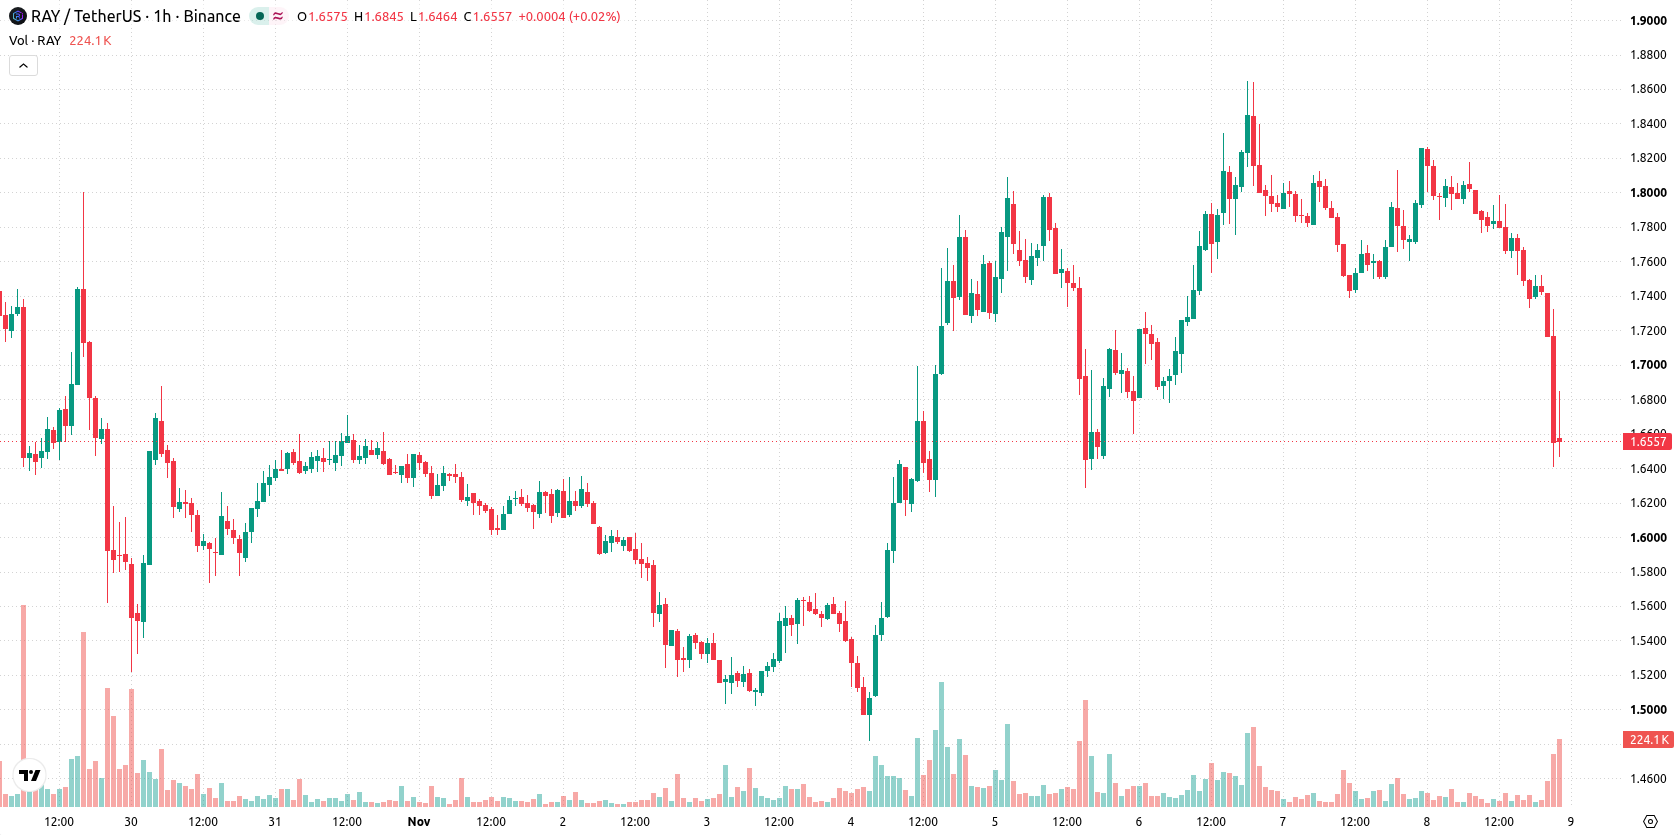
Raydium (RAY) is trading at $1.65, down 7.52% on the day. The asset remains below its short- and medium-term moving averages but above its longer-term average.
 1.4275
1.8135
Highlights
- Raydium daily trading volume remained 38% below its monthly average as of November 8, 2026, reducing market activity.
- No new legal or regulatory developments specific to Raydium were reported during this period.
- RAY/USD experienced a 7.52% intraday decline with persistent bearish momentum and is expected to remain in a $1.5686 to $1.74 range over the next 2 to 3 days.
Diminished trading activity intensifies volatility amid tepid sentiment
Raydium's daily trading volume remained approximately 38% below its monthly average as of November 8, 2026, highlighting diminished market participation and potentially limiting near-term liquidity. This suppressed activity may constrain price discovery and amplify volatility, reflecting tepid trading interest in the absence of material corporate events. No new legal or regulatory developments specific to Raydium were observed during this period, according to Diariobitcoin.
Bearish momentum established as moving averages resist recovery
On the h1 timeframe, RAY is trading below both the MA-20 at $1.77 and MA-50 at $1.77, while holding above the MA-200 at $1.04. The Ichimoku Kijun at $1.77 acts as immediate resistance. Momentum indicators, including MACD and ADX, show continued selling conditions. RSI and Stochastic RSI remain neutral, whereas CCI is in the oversold zone, suggesting some selling exhaustion. Bearish dominance is further confirmed by the negative Bull/Bear Power reading and the Awesome Oscillator signaling selling pressure.
Limited breakout potential as downside risk predominates in consolidation
In the near term, price action is expected to remain volatile within a range of $1.57 to $1.74. The likelihood of an upward breakout is very low, while the high probability scenario calls for further downward movement. The baseline assumption is for the price to consolidate sideways inside the stated volatility band. Should RAY break above the $1.77 resistance, it could signal a bullish reversal; a slip below $1.57 would reinforce downside momentum.
Earlier, analysts noted that Raydium was exhibiting technically driven price strength amid increased volatility but lacked fundamental catalysts. The current data signals a shift toward bearish momentum with diminished market participation, making the $1.57 downside threshold the principal level for traders to monitor in the coming sessions.










-
 Afghanistan
-
 Albania
-
 Algeria
-
 Angola
-
 Argentina
-
 Armenia
-
 Australia
-
 Austria
-
 Azerbaijan
-
 Bahamas
-
 Bahrain
-
 Bangladesh
-
 Belarus
-
 Belgium
-
 Bolivia
-
 Botswana
-
 Brazil
-
 Brunei
-
 Bulgaria
-
 Cambodia
-
 Cameroon
-
 Canada
-
 Chile
-
 China
-
 Colombia
-
 Congo
-
 Costa Rica
-
 Cote d'Ivoire
-
 Croatia
-
 Cuba
-
 Cyprus
-
 Czechia
-
 DR Congo
-
 Denmark
-
 Dominican Republic
-
 Ecuador
-
 Egypt
-
 El Salvador
-
 Estonia
-
 Eswatini
-
 Ethiopia
-
 Finland
-
 France
-
 Georgia
-
 Germany
-
 Ghana
-
 Greece
-
 Haiti
-
 Hong Kong
-
 Hungary
-
 India
-
 Indonesia
-
 Iran, Islamic republic
-
 Iraq
-
 Ireland
-
 Israel
-
 Italy
-
 Jamaica
-
 Japan
-
 Jordan
-
 Kazakhstan
-
 Kenya
-
 Korea
-
 Kuwait
-
 Kyrgyzstan
-
 Laos
-
 Latvia
-
 Lebanon
-
 Lesotho
-
 Libya
-
 Lithuania
-
 Luxembourg
-
 Madagascar
-
 Malaysia
-
 Malta
-
 Mauritius
-
 Mexico
-
 Moldova
-
 Mongolia
-
 Montenegro
-
 Morocco
-
 Mozambique
-
 Myanmar
-
 Namibia
-
 Nepal
-
 Netherlands
-
 New Zealand
-
 Nigeria
-
 North Macedonia
-
 Norway
-
 Oman
-
 Pakistan
-
 Palestine
-
 Panama
-
 Papua New Guinea
-
 Paraguay
-
 Peru
-
 Philippines
-
 Poland
-
 Portugal
-
 Puerto Rico
-
 Qatar
-
 Reunion
-
 Romania
-
 Rwanda
-
 Saudi Arabia
-
 Serbia
-
 Singapore
-
 Slovakia
-
 Slovenia
-
 Somalia
-
 South Africa
-
 Spain
-
 Sri Lanka
-
 Sweden
-
 Switzerland
-
 Syria
-
 Taiwan
-
 Tajikistan
-
 Tanzania
-
 Thailand
-
 Trinidad and Tobago
-
 Tunisia
-
 Turkey
-
 UAE
-
 Uganda
-
 Ukraine
-
 United Kingdom
-
United States
-
 Uruguay
-
 Uzbekistan
-
 Venezuela
-
 Vietnam
-
 Yemen
-
 Zambia
-
 Zimbabwe
- Forex
- Crypto












