

What's behind Quant's latest 8.4% price pullback?

Quant (QNT) fell 8.45% today as strong selling pressure and a downside gap drove momentum lower. The move is supported by prevailing bearish signals, with the price remaining below the 20-day and 50-day moving averages despite long-term support from the 200-day trend.
 149.99
162.06
Highlights
- QNT/USD trades below short- and medium-term moving averages, indicating sellers control the current trend.
- Momentum indicators show sell signals, with the MACD, ADX, and BBP negative, confirming persistent bearish momentum.
- Key support is at $140.67 and resistance at $149.99, with a projected range of $127.95 to $153.145 and a 78% probability of a further decline.
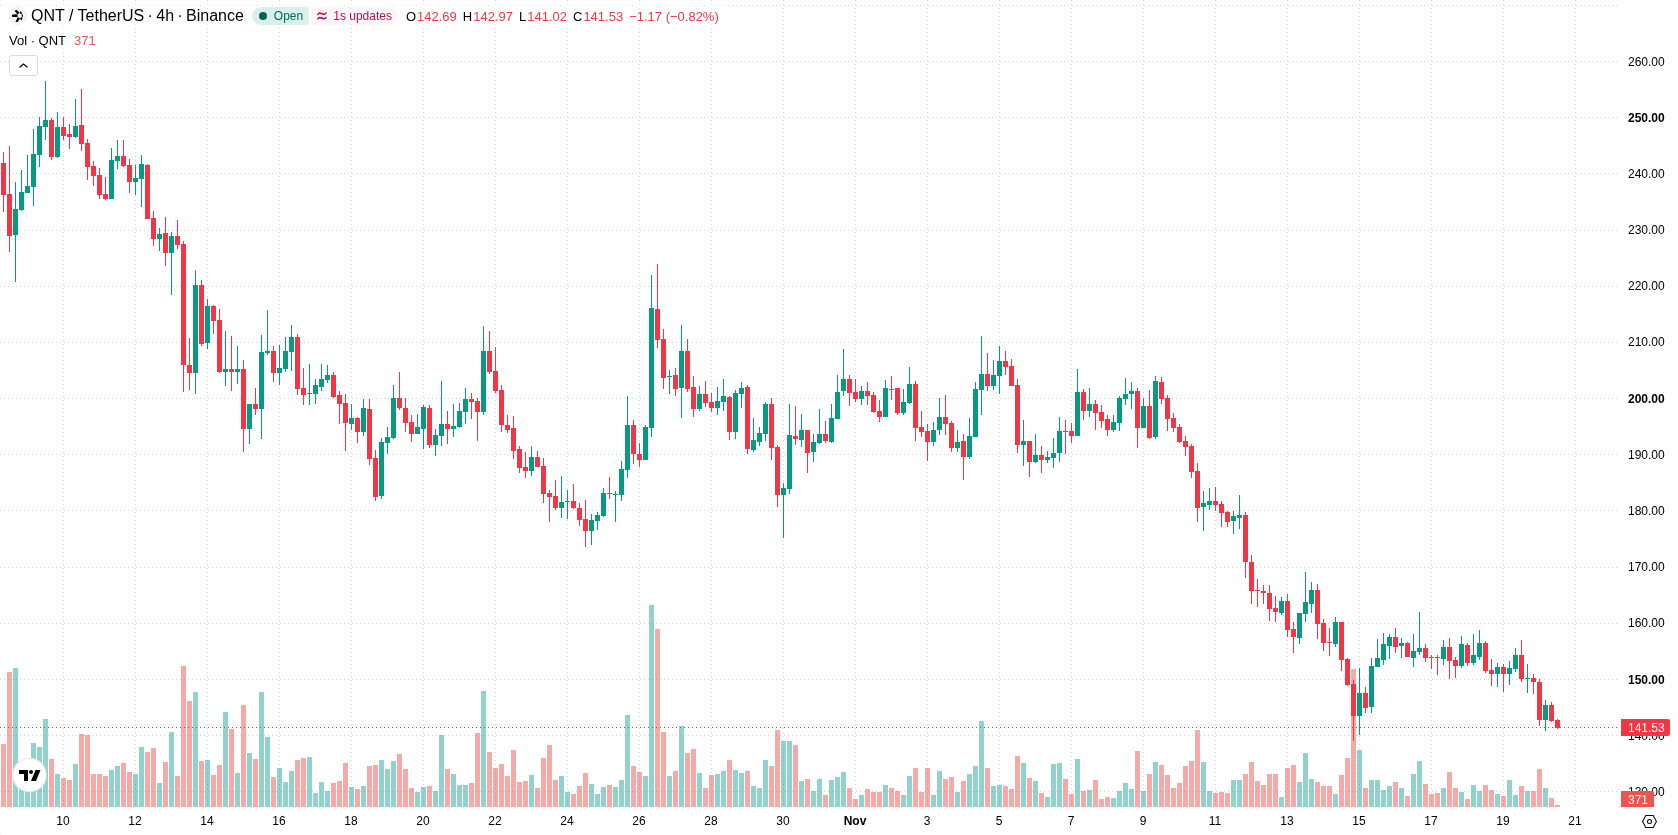
Bearish momentum confirmed as price holds below short-term averages
QNT/USD is trading below the 20-day and 50-day moving averages, with the current price at $141.59 relative to MA-20 at $177.625 and MA-50 at $200.9518. It remains above the 200-day moving average at $104.90365, signalling long-term bullish alignment, but sellers are controlling the short- and medium-term trend, with key support at $140.67 and resistance at $149.99. Momentum indicators reinforce the recent downside. The MACD and Average Directional Index (ADX) both show sell signals, confirming bearish momentum. The Relative Strength Index (RSI), Stochastic RSI, and Commodity Channel Index (CCI) are all in neutral zones, indicating none are in overbought or oversold territory. Bull/Bear Power (BBP) is negative, showing that sellers dominate the intraday session. The Awesome Oscillator is neutral and does not provide additional confirmation. The pair has dropped $13.07 or 8.45% today, opening with a downside gap of roughly $5.13 (3.32%). Price action is near the daily low with volatility at 6.63%. The session is marked by strong pressure following the gap down, with sellers maintaining control.
Earlier, analysts noted that Quant was trading in a period of consolidation marked by heightened volatility and mixed momentum signals. The latest developments reinforce a prevailing downside bias, with traders advised to watch for a decisive break below $140.67 as a signal for potential further weakness.










-
 Afghanistan
-
 Albania
-
 Algeria
-
 Angola
-
 Argentina
-
 Armenia
-
 Australia
-
 Austria
-
 Azerbaijan
-
 Bahamas
-
 Bahrain
-
 Bangladesh
-
 Belarus
-
 Belgium
-
 Bolivia
-
 Botswana
-
 Brazil
-
 Brunei
-
 Bulgaria
-
 Cambodia
-
 Cameroon
-
 Canada
-
 Chile
-
 China
-
 Colombia
-
 Congo
-
 Costa Rica
-
 Cote d'Ivoire
-
 Croatia
-
 Cuba
-
 Cyprus
-
 Czechia
-
 DR Congo
-
 Denmark
-
 Dominican Republic
-
 Ecuador
-
 Egypt
-
 El Salvador
-
 Estonia
-
 Eswatini
-
 Ethiopia
-
 Finland
-
 France
-
 Georgia
-
 Germany
-
 Ghana
-
 Greece
-
 Haiti
-
 Hong Kong
-
 Hungary
-
 India
-
 Indonesia
-
 Iran, Islamic republic
-
 Iraq
-
 Ireland
-
 Israel
-
 Italy
-
 Jamaica
-
 Japan
-
 Jordan
-
 Kazakhstan
-
 Kenya
-
 Korea
-
 Kuwait
-
 Kyrgyzstan
-
 Laos
-
 Latvia
-
 Lebanon
-
 Lesotho
-
 Libya
-
 Lithuania
-
 Luxembourg
-
 Madagascar
-
 Malaysia
-
 Malta
-
 Mauritius
-
 Mexico
-
 Moldova
-
 Mongolia
-
 Montenegro
-
 Morocco
-
 Mozambique
-
 Myanmar
-
 Namibia
-
 Nepal
-
 Netherlands
-
 New Zealand
-
 Nigeria
-
 North Macedonia
-
 Norway
-
 Oman
-
 Pakistan
-
 Palestine
-
 Panama
-
 Papua New Guinea
-
 Paraguay
-
 Peru
-
 Philippines
-
 Poland
-
 Portugal
-
 Puerto Rico
-
 Qatar
-
 Reunion
-
 Romania
-
 Rwanda
-
 Saudi Arabia
-
 Serbia
-
 Singapore
-
 Slovakia
-
 Slovenia
-
 Somalia
-
 South Africa
-
 Spain
-
 Sri Lanka
-
 Sweden
-
 Switzerland
-
 Syria
-
 Taiwan
-
 Tajikistan
-
 Tanzania
-
 Thailand
-
 Trinidad and Tobago
-
 Tunisia
-
 Turkey
-
 UAE
-
 Uganda
-
 Ukraine
-
 United Kingdom
-
United States
-
 Uruguay
-
 Uzbekistan
-
 Venezuela
-
 Vietnam
-
 Yemen
-
 Zambia
-
 Zimbabwe
- Forex
- Crypto












