

Quant falls as downward price move extends below short- and medium-term averages

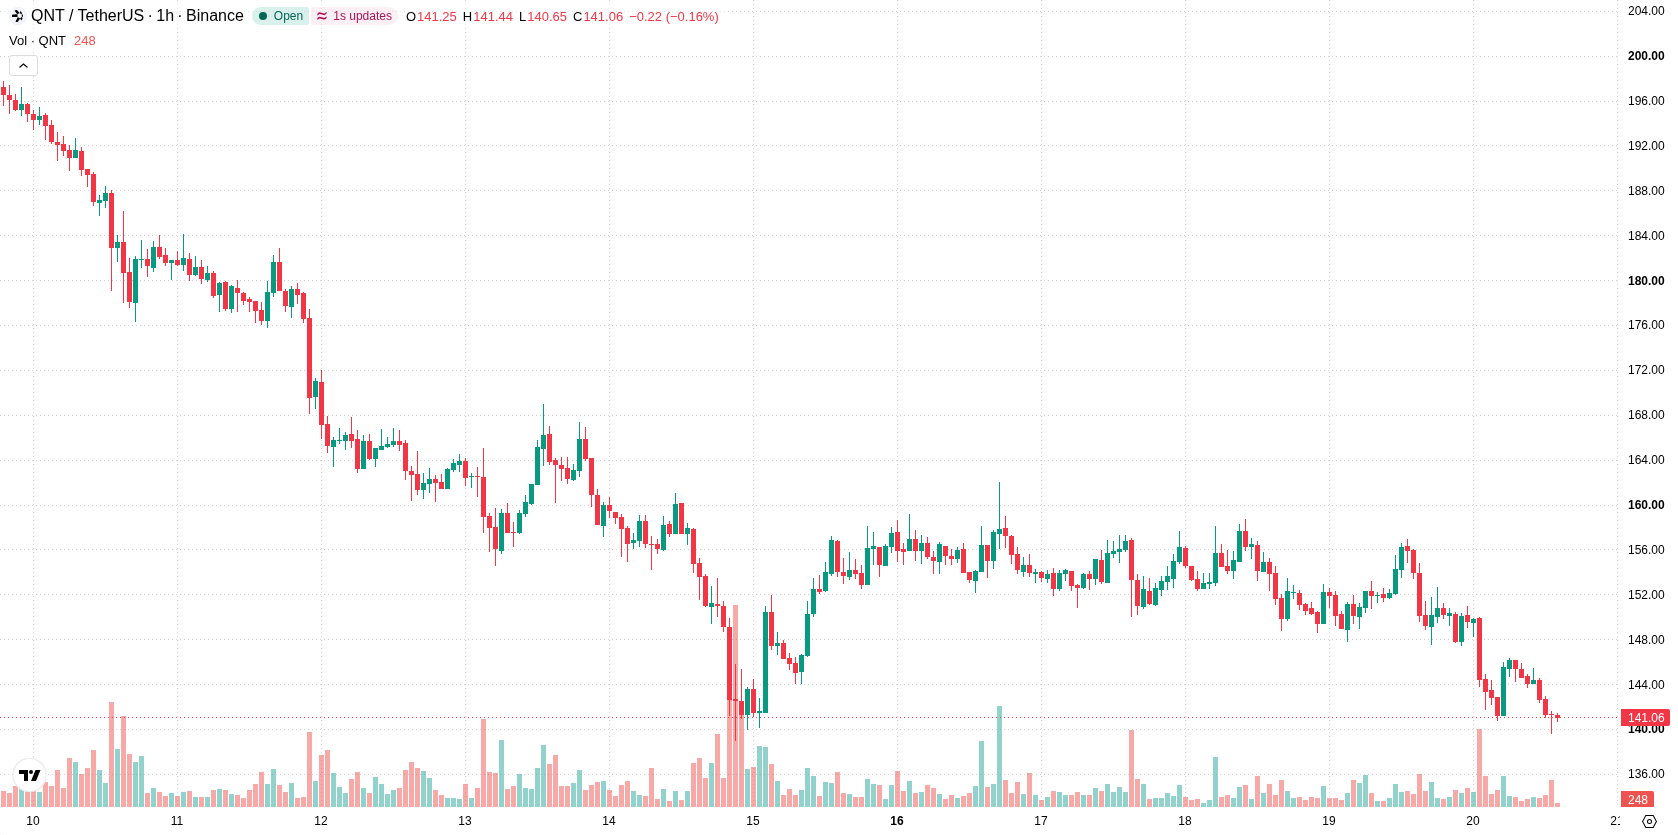
Quant (QNT) is trading at $140.94, posting a daily drop of 8.85%. The price sits below its key short- and medium-term moving averages but remains above the long-term average, reflecting a volatile trading day.
 149.99
162.06
Highlights
- QNT/USD trades below short- and medium-term moving averages, confirming strong downward momentum in the near term.
- Price fell 8.85% intraday to $140.94, remaining near today’s low in a highly volatile session.
- Indicators confirm dominant selling pressure, with support at $124.87 and resistance at $148.82, range forecast at $124.87 to $146.107553 over the next two to three days.
Bearish momentum prevails as short-term supports erode
Technical analysis for QNT/USD shows the asset is trading below H1 SMA-20 at $145.802 and H1 SMA-50 at $149.4434, underscoring current bearish momentum in the short and medium term. However, the price remains above the D1 SMA-200 at $104.90365, preserving a bullish long-term structure. On the indicator front, both MACD and ADX are on Sell, while RSI and Stoch RSI sit in neutral territory. CCI is oversold, indicating potential selling exhaustion, whereas Bull/Bear Power remains negative, and the Awesome Oscillator issues a Sell signal. Immediate resistance is marked by the Ichimoku Kijun at $148.82, and support is observed near $124.87.
Downside risk elevated amid limited rebound odds
Over the next two to three trading days, QNT/USD is expected to remain within the $124.87 to $146.10 volatility band relative to current levels. The probability of a move higher is very low, while further downside risk is pronounced. The baseline scenario anticipates sideways consolidation between these ranges; a bullish outcome requires a break above resistance at $148.82, while a bearish scenario unfolds if the price falls below support at $124.87.
Earlier, analysts noted that Quant was experiencing continued bearish momentum with sellers in control of the short- and medium-term trend. The latest data confirms this bearish outlook remains intact, and traders should closely monitor the pivotal $124.87 support level for signs of either further downside or potential stabilization.










-
 Afghanistan
-
 Albania
-
 Algeria
-
 Angola
-
 Argentina
-
 Armenia
-
 Australia
-
 Austria
-
 Azerbaijan
-
 Bahamas
-
 Bahrain
-
 Bangladesh
-
 Belarus
-
 Belgium
-
 Bolivia
-
 Botswana
-
 Brazil
-
 Brunei
-
 Bulgaria
-
 Cambodia
-
 Cameroon
-
 Canada
-
 Chile
-
 China
-
 Colombia
-
 Congo
-
 Costa Rica
-
 Cote d'Ivoire
-
 Croatia
-
 Cuba
-
 Cyprus
-
 Czechia
-
 DR Congo
-
 Denmark
-
 Dominican Republic
-
 Ecuador
-
 Egypt
-
 El Salvador
-
 Estonia
-
 Eswatini
-
 Ethiopia
-
 Finland
-
 France
-
 Georgia
-
 Germany
-
 Ghana
-
 Greece
-
 Haiti
-
 Hong Kong
-
 Hungary
-
 India
-
 Indonesia
-
 Iran, Islamic republic
-
 Iraq
-
 Ireland
-
 Israel
-
 Italy
-
 Jamaica
-
 Japan
-
 Jordan
-
 Kazakhstan
-
 Kenya
-
 Korea
-
 Kuwait
-
 Kyrgyzstan
-
 Laos
-
 Latvia
-
 Lebanon
-
 Lesotho
-
 Libya
-
 Lithuania
-
 Luxembourg
-
 Madagascar
-
 Malaysia
-
 Malta
-
 Mauritius
-
 Mexico
-
 Moldova
-
 Mongolia
-
 Montenegro
-
 Morocco
-
 Mozambique
-
 Myanmar
-
 Namibia
-
 Nepal
-
 Netherlands
-
 New Zealand
-
 Nigeria
-
 North Macedonia
-
 Norway
-
 Oman
-
 Pakistan
-
 Palestine
-
 Panama
-
 Papua New Guinea
-
 Paraguay
-
 Peru
-
 Philippines
-
 Poland
-
 Portugal
-
 Puerto Rico
-
 Qatar
-
 Reunion
-
 Romania
-
 Rwanda
-
 Saudi Arabia
-
 Serbia
-
 Singapore
-
 Slovakia
-
 Slovenia
-
 Somalia
-
 South Africa
-
 Spain
-
 Sri Lanka
-
 Sweden
-
 Switzerland
-
 Syria
-
 Taiwan
-
 Tajikistan
-
 Tanzania
-
 Thailand
-
 Trinidad and Tobago
-
 Tunisia
-
 Turkey
-
 UAE
-
 Uganda
-
 Ukraine
-
 United Kingdom
-
United States
-
 Uruguay
-
 Uzbekistan
-
 Venezuela
-
 Vietnam
-
 Yemen
-
 Zambia
-
 Zimbabwe
- Forex
- Crypto












