

Bonk falls nearly 12% as persistent technical selling pressure drives price lower

Bonk (BONK) slumped 11.97% on the day as persistent technical selling pressure weighed on price action. The move is supported by the coin's sustained position below its 20-day, 50-day, and 200-day moving averages, underscoring ongoing downside momentum.
 0.0523
0.05272
Highlights
- BONK/USD trades below key short- and long-term moving averages, signaling persistent seller control across all timeframes.
- Technical indicators including MACD, ADX, CCI, and BBP collectively favor further selling pressure with a weak momentum profile.
- Trading range for the next five days is projected at $0.00000177 to $0.00000236, with high probability of further downside.
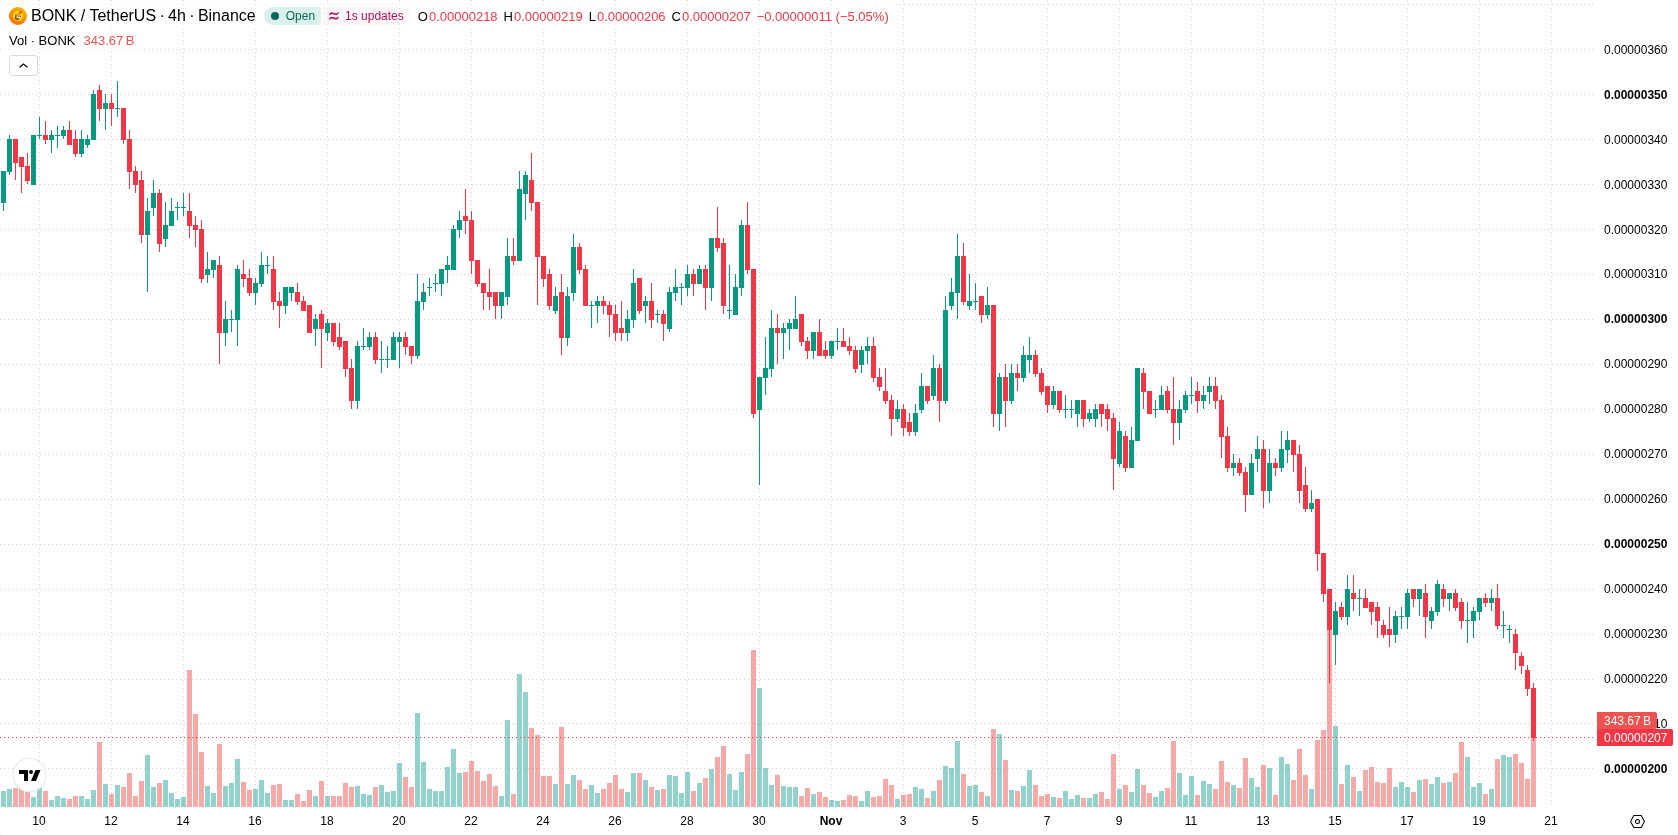
Bearish alignment as major averages and momentum indicators signal pressure
BONK/USD is trading below the 20-day, 50-day, and 200-day moving averages at $0.00000268, $0.00000303, and $0.00000377 respectively. This setup confirms ongoing pressure from sellers across all timeframes, with the near-term ceiling at $0.00000219 and floor at $0.00000177 remaining key levels. The medium- and long-term alignment is bearish. Momentum signals remain weak, with both the MACD and Average Directional Index (ADX) pointing toward further selling pressure. The Relative Strength Index (RSI) and Stochastic RSI are neutral, while the Commodity Channel Index (CCI) is in oversold territory. The Bull/Bear Power (BBP) value is negative, showing sellers are in control of intraday momentum. Daily price action shows the price at $0.0000021, falling 11.97% on the day with a downside gap of around 13.04%. The price is near the session low after intraday volatility of 4.55%, reflecting continued pressure following the open. Price and momentum are broadly aligned on the downside, with no clear divergence among the core indicators.
Earlier, analysts noted that Bonk was exhibiting persistent bearish momentum, with technical indicators highlighting continued downside risk. The latest developments support this outlook, as increased selling pressure and weak momentum suggest traders should closely monitor $0.00000177 as a critical support level in the near term.










-
 Afghanistan
-
 Albania
-
 Algeria
-
 Angola
-
 Argentina
-
 Armenia
-
 Australia
-
 Austria
-
 Azerbaijan
-
 Bahamas
-
 Bahrain
-
 Bangladesh
-
 Belarus
-
 Belgium
-
 Bolivia
-
 Botswana
-
 Brazil
-
 Brunei
-
 Bulgaria
-
 Cambodia
-
 Cameroon
-
 Canada
-
 Chile
-
 China
-
 Colombia
-
 Congo
-
 Costa Rica
-
 Cote d'Ivoire
-
 Croatia
-
 Cuba
-
 Cyprus
-
 Czechia
-
 DR Congo
-
 Denmark
-
 Dominican Republic
-
 Ecuador
-
 Egypt
-
 El Salvador
-
 Estonia
-
 Eswatini
-
 Ethiopia
-
 Finland
-
 France
-
 Georgia
-
 Germany
-
 Ghana
-
 Greece
-
 Haiti
-
 Hong Kong
-
 Hungary
-
 India
-
 Indonesia
-
 Iran, Islamic republic
-
 Iraq
-
 Ireland
-
 Israel
-
 Italy
-
 Jamaica
-
 Japan
-
 Jordan
-
 Kazakhstan
-
 Kenya
-
 Korea
-
 Kuwait
-
 Kyrgyzstan
-
 Laos
-
 Latvia
-
 Lebanon
-
 Lesotho
-
 Libya
-
 Lithuania
-
 Luxembourg
-
 Madagascar
-
 Malaysia
-
 Malta
-
 Mauritius
-
 Mexico
-
 Moldova
-
 Mongolia
-
 Montenegro
-
 Morocco
-
 Mozambique
-
 Myanmar
-
 Namibia
-
 Nepal
-
 Netherlands
-
 New Zealand
-
 Nigeria
-
 North Macedonia
-
 Norway
-
 Oman
-
 Pakistan
-
 Palestine
-
 Panama
-
 Papua New Guinea
-
 Paraguay
-
 Peru
-
 Philippines
-
 Poland
-
 Portugal
-
 Puerto Rico
-
 Qatar
-
 Reunion
-
 Romania
-
 Rwanda
-
 Saudi Arabia
-
 Serbia
-
 Singapore
-
 Slovakia
-
 Slovenia
-
 Somalia
-
 South Africa
-
 Spain
-
 Sri Lanka
-
 Sweden
-
 Switzerland
-
 Syria
-
 Taiwan
-
 Tajikistan
-
 Tanzania
-
 Thailand
-
 Trinidad and Tobago
-
 Tunisia
-
 Turkey
-
 UAE
-
 Uganda
-
 Ukraine
-
 United Kingdom
-
United States
-
 Uruguay
-
 Uzbekistan
-
 Venezuela
-
 Vietnam
-
 Yemen
-
 Zambia
-
 Zimbabwe
- Forex
- Crypto












