

Quant slides lower as seller pressure dominates and technical momentum stays negative

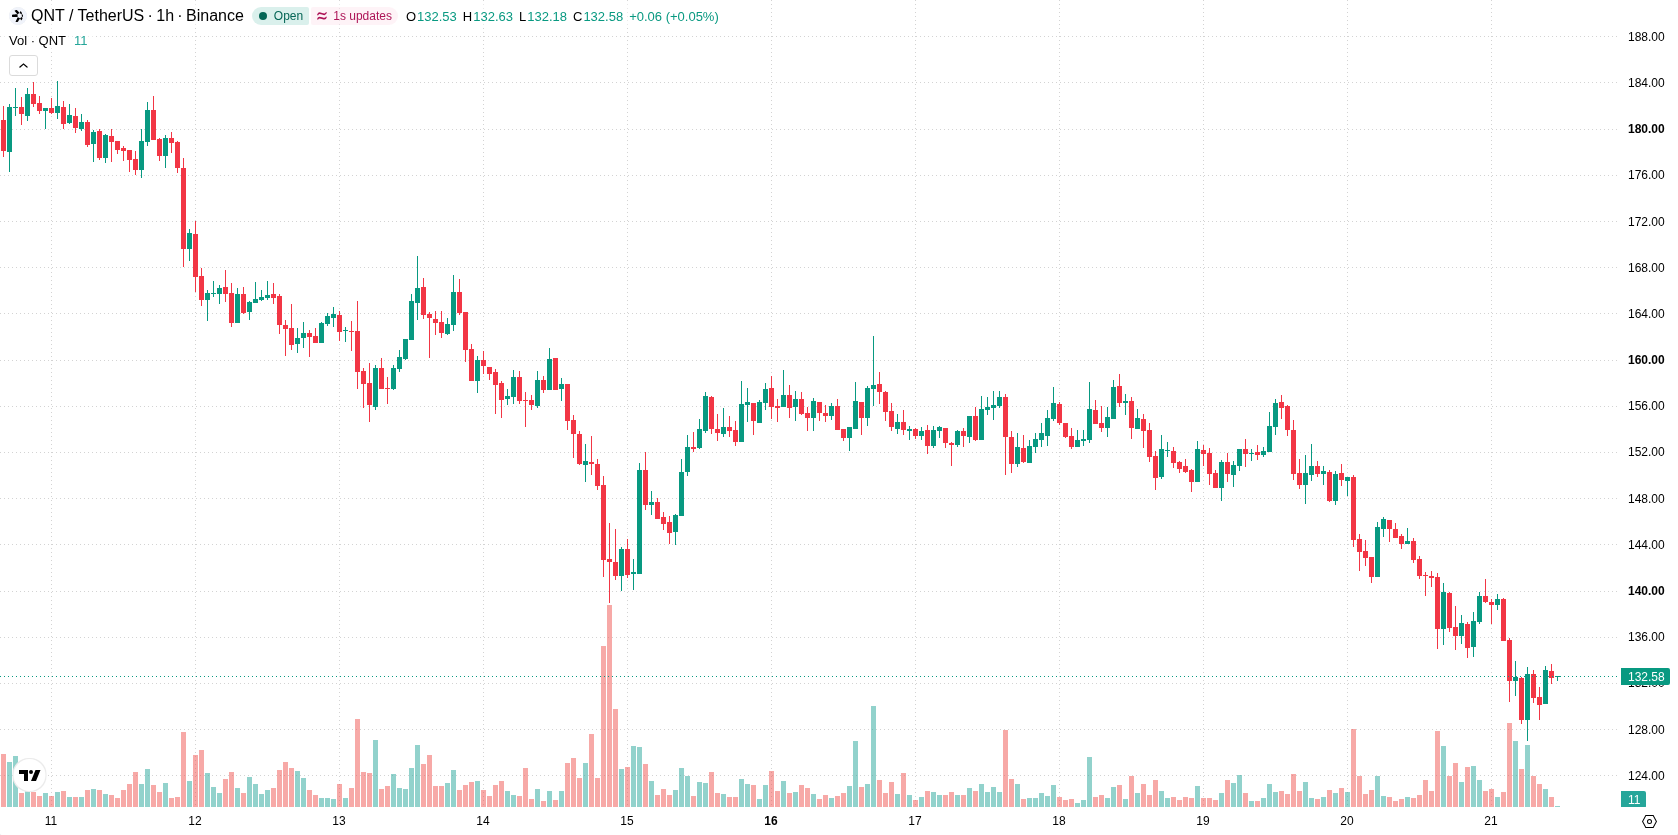
Quant (QNT) is trading at $132.54 after a steep 8.25% drop on the day. The price currently sits below its key short- and medium-term moving averages, with longer-term trend support still in place.
 139.69
162.06
Highlights
- QNT/USD trades below key short-term moving averages, indicating persistent selling pressure in the immediate time frame.
- Momentum indicators MACD and ADX confirm a bearish trend, with oscillators showing no overbought or oversold signals.
- Expected short-term range is $126.310315 to $138.769685, with a 71% probability of further downside from current levels.
Intraday selling prevails as price stalls below resistance zones
The H1 SMA-20 at $135.5865 and H1 SMA-50 at $143.0756 both serve as immediate technical barriers, with QNT/USD holding below these key moving averages. However, the price remains above the long-term D1 SMA-200 at $105.24695, confirming ongoing structural support. The Ichimoku Kijun at $136.41 marks the nearest resistance to the upside. Technical momentum indicators are predominantly negative, with both MACD and ADX signaling ongoing selling pressure. Oscillators such as RSI, Stochastic RSI, and CCI are all registering neutral readings, indicating neither overbought nor oversold conditions. Bull/Bear Power is negative at –1.898677, highlighting current dominance by sellers on the intraday chart, while the Awesome Oscillator remains neutral.
Downside favored unless resistance reclaimed in volatile range
In the near term, QNT/USD is expected to oscillate within the $126.310315 to $138.769685 volatility range. Market modeling assigns a 71% probability to continued downside action, with upside moves less likely at 29%. A bullish scenario would require the price to reclaim and sustain levels above the Ichimoku Kijun resistance at $136.41. Should QNT/USD lose forecast support, further losses toward the lower boundary of the projected trading band could ensue.
Earlier, analysts noted that Quant was experiencing ongoing bearish momentum with sellers maintaining control of the short- and medium-term trend. The current assessment strengthens this outlook, as additional technical weakness now points to heightened downside risk, making the $126.31 support a critical level for traders to monitor in the sessions ahead.










-
 Afghanistan
-
 Albania
-
 Algeria
-
 Angola
-
 Argentina
-
 Armenia
-
 Australia
-
 Austria
-
 Azerbaijan
-
 Bahamas
-
 Bahrain
-
 Bangladesh
-
 Belarus
-
 Belgium
-
 Bolivia
-
 Botswana
-
 Brazil
-
 Brunei
-
 Bulgaria
-
 Cambodia
-
 Cameroon
-
 Canada
-
 Chile
-
 China
-
 Colombia
-
 Congo
-
 Costa Rica
-
 Cote d'Ivoire
-
 Croatia
-
 Cuba
-
 Cyprus
-
 Czechia
-
 DR Congo
-
 Denmark
-
 Dominican Republic
-
 Ecuador
-
 Egypt
-
 El Salvador
-
 Estonia
-
 Eswatini
-
 Ethiopia
-
 Finland
-
 France
-
 Georgia
-
 Germany
-
 Ghana
-
 Greece
-
 Haiti
-
 Hong Kong
-
 Hungary
-
 India
-
 Indonesia
-
 Iran, Islamic republic
-
 Iraq
-
 Ireland
-
 Israel
-
 Italy
-
 Jamaica
-
 Japan
-
 Jordan
-
 Kazakhstan
-
 Kenya
-
 Korea
-
 Kuwait
-
 Kyrgyzstan
-
 Laos
-
 Latvia
-
 Lebanon
-
 Lesotho
-
 Libya
-
 Lithuania
-
 Luxembourg
-
 Madagascar
-
 Malaysia
-
 Malta
-
 Mauritius
-
 Mexico
-
 Moldova
-
 Mongolia
-
 Montenegro
-
 Morocco
-
 Mozambique
-
 Myanmar
-
 Namibia
-
 Nepal
-
 Netherlands
-
 New Zealand
-
 Nigeria
-
 North Macedonia
-
 Norway
-
 Oman
-
 Pakistan
-
 Palestine
-
 Panama
-
 Papua New Guinea
-
 Paraguay
-
 Peru
-
 Philippines
-
 Poland
-
 Portugal
-
 Puerto Rico
-
 Qatar
-
 Reunion
-
 Romania
-
 Rwanda
-
 Saudi Arabia
-
 Serbia
-
 Singapore
-
 Slovakia
-
 Slovenia
-
 Somalia
-
 South Africa
-
 Spain
-
 Sri Lanka
-
 Sweden
-
 Switzerland
-
 Syria
-
 Taiwan
-
 Tajikistan
-
 Tanzania
-
 Thailand
-
 Trinidad and Tobago
-
 Tunisia
-
 Turkey
-
 UAE
-
 Uganda
-
 Ukraine
-
 United Kingdom
-
United States
-
 Uruguay
-
 Uzbekistan
-
 Venezuela
-
 Vietnam
-
 Yemen
-
 Zambia
-
 Zimbabwe
- Forex
- Crypto












