


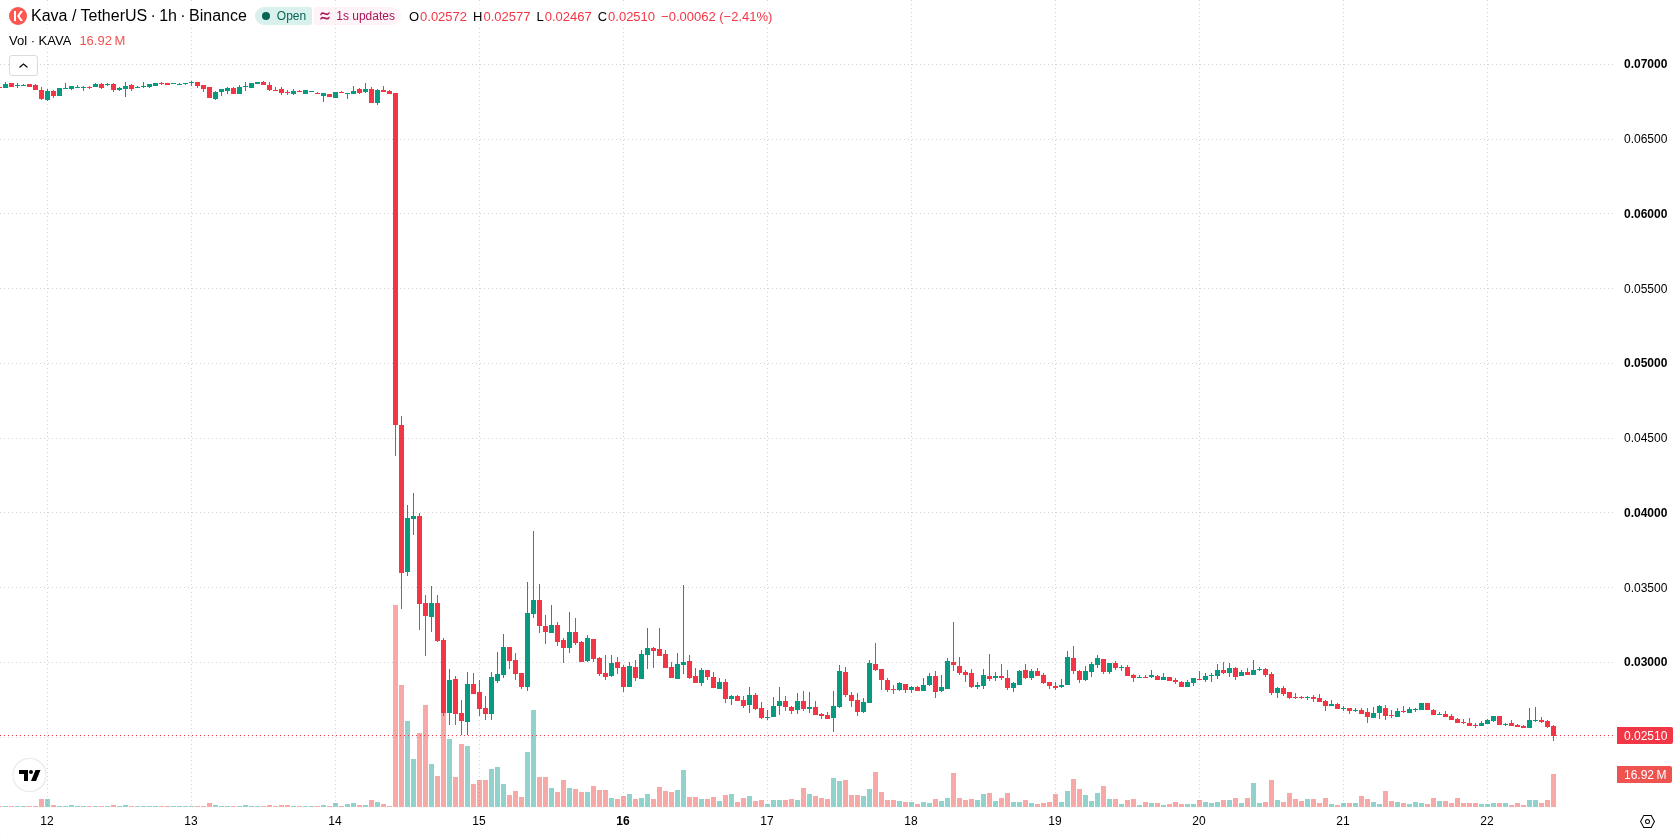
Kava (KAVA) is trading at $0.025, marking a daily decline of 7.17%. The asset remains below its key short-, medium-, and long-term moving averages, signaling ongoing downside pressure.
 0.027
0.0352
Highlights
- KAVA/USD trades below key short-, medium-, and long-term moving averages, indicating persistent downward pressure across all timeframes.
- MACD signals strong sell momentum, but mixed readings from ADX and oscillators suggest potential for brief sideways moves or a minor correction.
- KAVA slipped 7.17% and is expected to trade between $0.0221 to $0.0272 with high probability of further decline unless $0.0264 resistance breaks.
Mixed momentum and weak buy signals amid strong resistance
On the technical front, KAVA/USD is positioned below the H1 SMA-20 at $0.026, the H1 SMA-50 at $0.0268, and the D1 SMA-200 at $0.0541. The Ichimoku Kijun provides immediate resistance at $0.0264. MACD signals strong sell momentum, while ADX indicates a buy, resulting in mixed momentum signals. Both RSI and CCI stand neutral, but Stochastic RSI is in the overbought zone, indicating a risk of short-term correction. Bull/Bear Power is slightly positive, reflecting only weak buying strength amid continued negative price action.
Sideways movement favored as upside probability diminishes
Looking ahead to the next trading day, KAVA is expected to trade within a range of $0.0221 to $0.0272, in line with typical volatility. The probability of an upward move is very low, whereas downside risk is high. A sideways scenario within this corridor is most likely; a bullish case would emerge only if price breaks above resistance at $0.0264, while a move below $0.0221 would signal a bearish extension.
Earlier, analysts noted that downside risks for Kava remained elevated in the aftermath of a protocol exploit, with technical signals favoring continued bearish momentum. The latest data reinforces this narrative, underscoring the importance of monitoring the $0.0221 support level as a breach could signal further downside risk in the near term.









-
 Afghanistan
-
 Albania
-
 Algeria
-
 Angola
-
 Argentina
-
 Armenia
-
 Australia
-
 Austria
-
 Azerbaijan
-
 Bahamas
-
 Bahrain
-
 Bangladesh
-
 Belarus
-
 Belgium
-
 Bolivia
-
 Botswana
-
 Brazil
-
 Brunei
-
 Bulgaria
-
 Cambodia
-
 Cameroon
-
 Canada
-
 Chile
-
 China
-
 Colombia
-
 Congo
-
 Costa Rica
-
 Cote d'Ivoire
-
 Croatia
-
 Cuba
-
 Cyprus
-
 Czechia
-
 DR Congo
-
 Denmark
-
 Dominican Republic
-
 Ecuador
-
 Egypt
-
 El Salvador
-
 Estonia
-
 Eswatini
-
 Ethiopia
-
 Finland
-
 France
-
 Georgia
-
 Germany
-
 Ghana
-
 Greece
-
 Haiti
-
 Hong Kong
-
 Hungary
-
 India
-
 Indonesia
-
 Iran, Islamic republic
-
 Iraq
-
 Ireland
-
 Israel
-
 Italy
-
 Jamaica
-
 Japan
-
 Jordan
-
 Kazakhstan
-
 Kenya
-
 Korea
-
 Kuwait
-
 Kyrgyzstan
-
 Laos
-
 Latvia
-
 Lebanon
-
 Lesotho
-
 Libya
-
 Lithuania
-
 Luxembourg
-
 Madagascar
-
 Malaysia
-
 Malta
-
 Mauritius
-
 Mexico
-
 Moldova
-
 Mongolia
-
 Montenegro
-
 Morocco
-
 Mozambique
-
 Myanmar
-
 Namibia
-
 Nepal
-
 Netherlands
-
 New Zealand
-
 Nigeria
-
 North Macedonia
-
 Norway
-
 Oman
-
 Pakistan
-
 Palestine
-
 Panama
-
 Papua New Guinea
-
 Paraguay
-
 Peru
-
 Philippines
-
 Poland
-
 Portugal
-
 Puerto Rico
-
 Qatar
-
 Reunion
-
 Romania
-
 Rwanda
-
 Saudi Arabia
-
 Serbia
-
 Singapore
-
 Slovakia
-
 Slovenia
-
 Somalia
-
 South Africa
-
 Spain
-
 Sri Lanka
-
 Sweden
-
 Switzerland
-
 Syria
-
 Taiwan
-
 Tajikistan
-
 Tanzania
-
 Thailand
-
 Trinidad and Tobago
-
 Tunisia
-
 Turkey
-
 UAE
-
 Uganda
-
 Ukraine
-
 United Kingdom
-
United States
-
 Uruguay
-
 Uzbekistan
-
 Venezuela
-
 Vietnam
-
 Yemen
-
 Zambia
-
 Zimbabwe
- Forex
- Crypto












