
Solana price stabilizes near key support after breaking its seven-month uptrend

Solana traded near $141 on Monday as the market attempted to steady itself following a sharp breakdown that ended its seven-month ascending channel. The structure that carried every major rally since April collapsed earlier this month when price sliced through the channel midline and lower boundary, confirming a full trend failure.
Highlights
- Solana trades near $141 after breaking its seven-month ascending channel.
- Price rests on key $135–$140 support as flows and EMAs keep momentum bearish.
- Derivatives data shows cautious positioning despite a short-term retail-led bounce.
Despite a mild rebound in the past two sessions, the broader tone remains cautious as Solana sits directly on a major support cluster.
Trend breaks as Solana tests major support
The technical picture remains bearish. Solana is trading below the 20-day EMA at $159, the 50-day at $178, and the 100-day at $185, forming the strongest downside alignment since March. Each rebound toward the 20-day EMA has been sold aggressively, signaling persistent overhead supply. As long as price remains below the $155–$160 region, buyers remain on the defensive and momentum favors further downside.
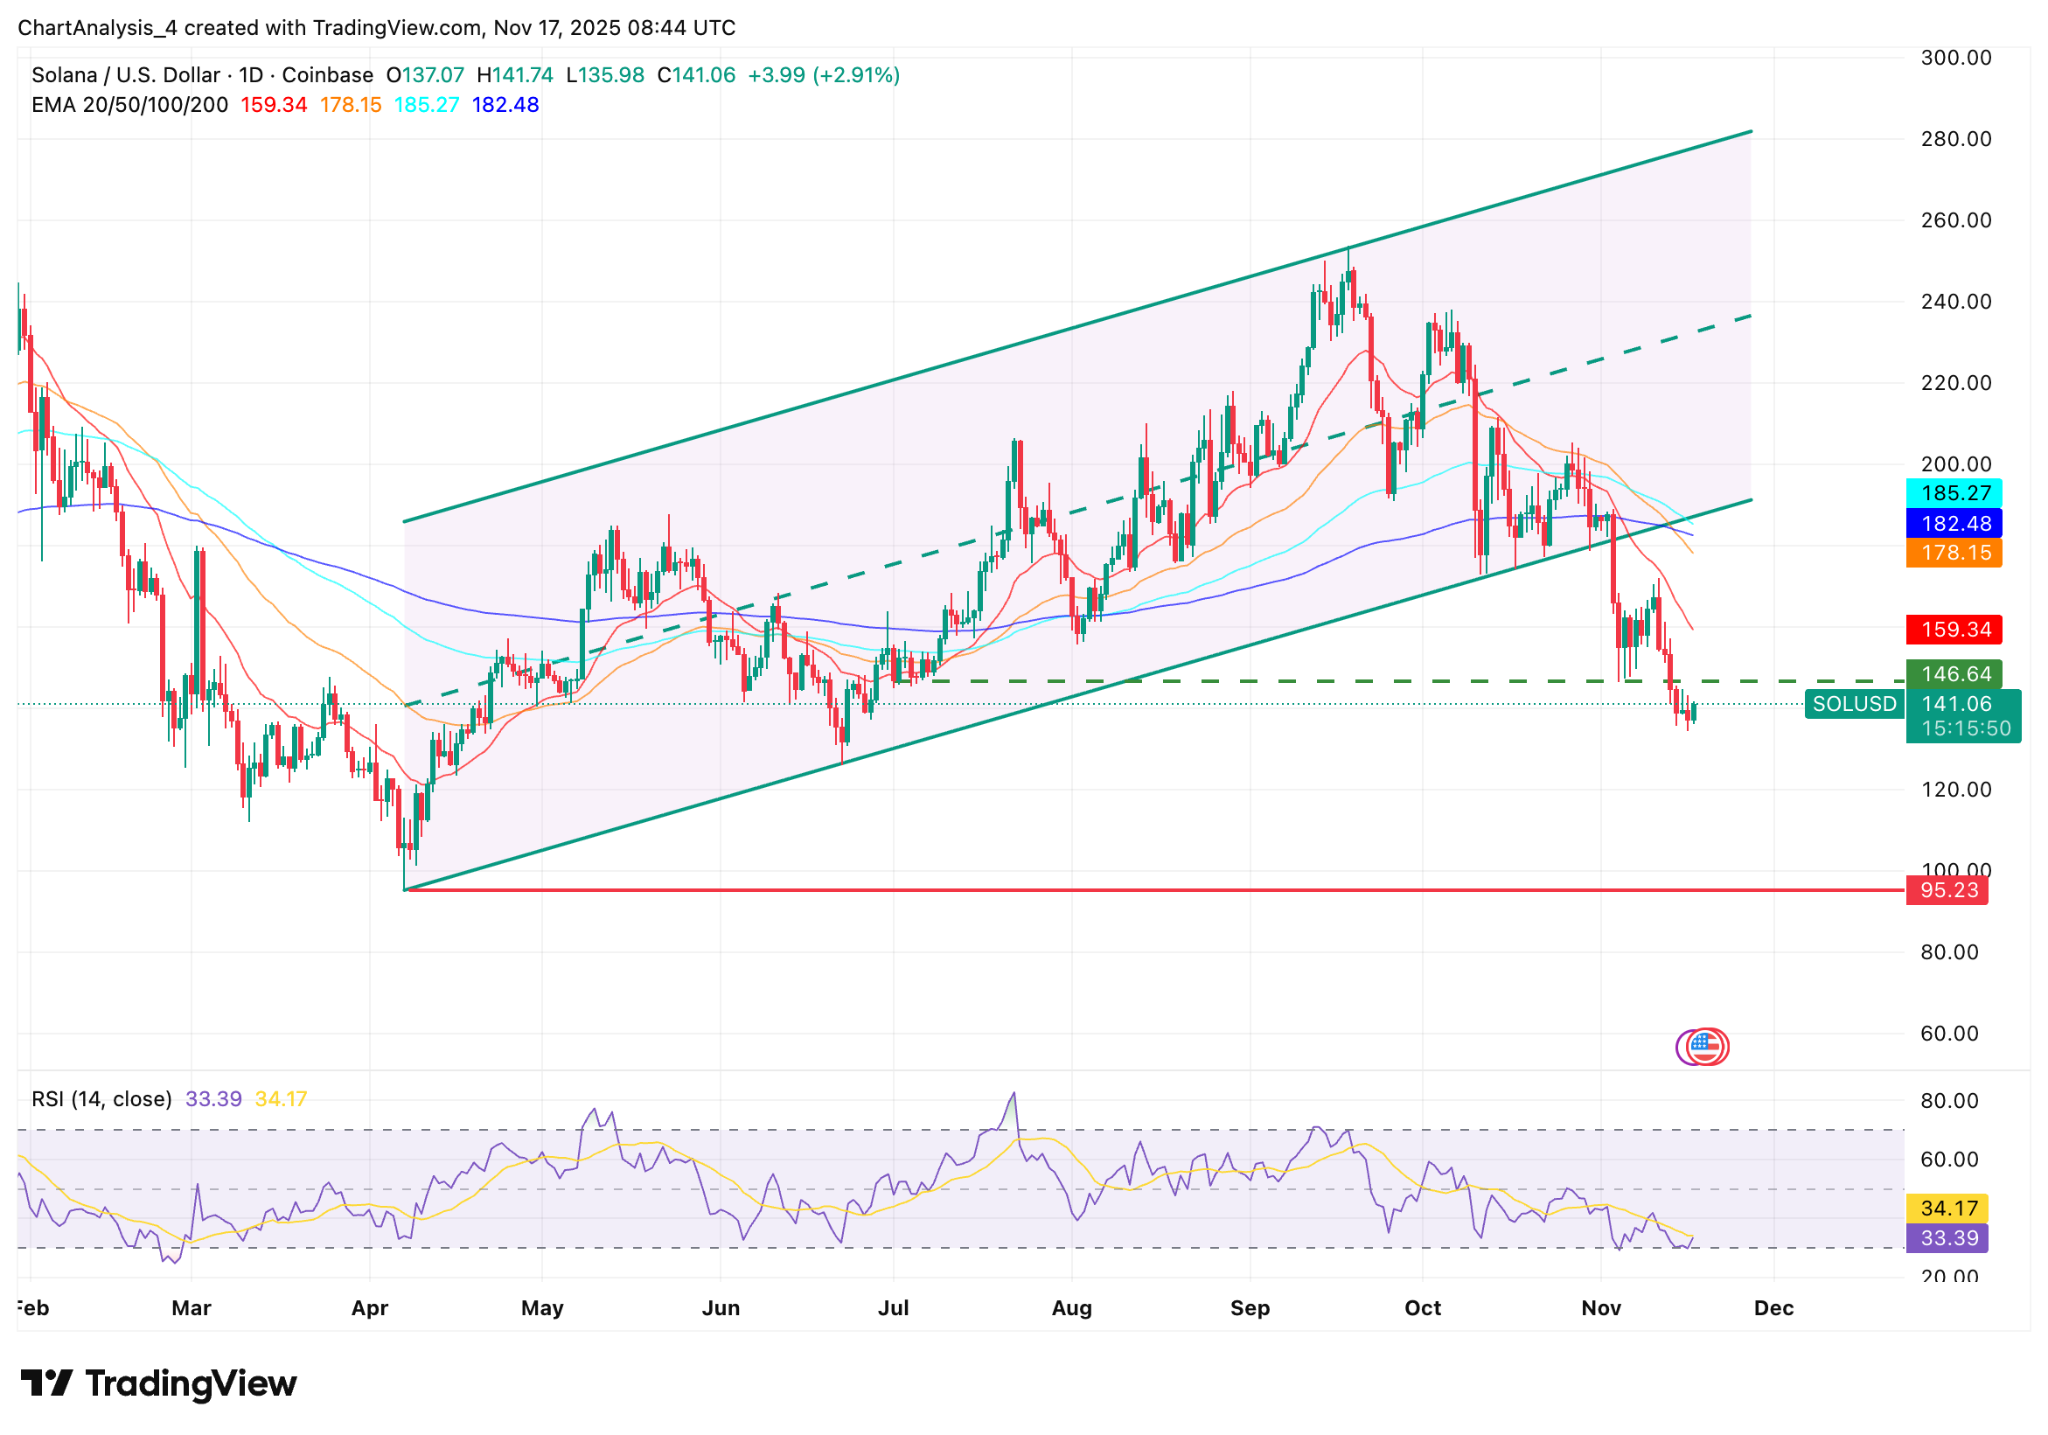
Solana price dynamics (Source: TradingView)
The breakdown has pushed Solana into the $135–$140 support cluster, an area that acted as a key reaction zone in both June and August. This shelf is now providing temporary stabilization, but a close below $135 would expose the deeper liquidity pocket around $120, followed by the larger demand block near $100, where a macro higher-low structure could form if long-term trend strength survives the decline.
Momentum reflects the weakness. The RSI sits near 33, oversold but not divergent, which suggests hesitation rather than capitulation. Throughout November, the indicator has trended downward without forming bullish signals, reinforcing the view that buyers remain cautious and liquidity is thinning near key levels.
Flows and derivatives reveal fragile sentiment
Spot flows show a market still shaped by distribution. Solana recorded heavy net outflows through most of November, including some of the largest red prints since early summer when price slid below $160. While the most recent reading showed a modest +$15.35M inflow, it comes after weeks of sustained selling pressure. Historically, Solana’s strongest reversals have emerged from multi-day accumulation clusters, something the market has not yet displayed.
Derivatives data is equally cautious. Futures open interest slipped 1.77 percent to $7.11B, reflecting reduced risk appetite during the breakdown. Trading volume surged 58.5 percent, but the long/short ratios show retail traders driving the bounce: Binance accounts lean long at 4.34, while OKX sits at 3.56, both levels that often attract larger counterparties looking to fade retail-heavy positioning.
Options activity tells a different story. Options volume has climbed 322 percent, with open interest up 41 percent, indicating that sophisticated traders are hedging volatility rather than positioning for immediate upside. This shift aligns with the market’s broader consolidation following the trend break.
If Solana holds the $135–$140 support, the market may attempt a recovery toward $155, the first major resistance within the new range. A daily close above $160 would be the first constructive signal in weeks and could open a move toward $175. Above $180, the structure turns more decisively bullish, with the next major test at the former channel base near $200.
Failure to hold $135, however, would clear the way for deeper losses toward $120 and then $100, levels that align with earlier consolidation zones and where long-term buyers may attempt to re-enter.
Outlook: Decisive move ahead as Solana straddles key support
For now, Solana sits at a vulnerable midpoint. Trend signals remain bearish, flows are fragile, and institutional traders are hedging rather than accumulating. At the same time, price rests on a major historical support band and the market is oversold. The next move away from $135–$140 will determine whether this becomes a short-term November correction or the start of a deeper unwind.
In our earlier coverage, we noted the risk of a breakdown as Solana repeatedly failed to reclaim the 20-day EMA and spot flows turned persistently negative. The subsequent slide below $160 and collapse of the ascending channel confirms that earlier weakness has now evolved into a full trend failure.


-
 Afghanistan
-
 Albania
-
 Algeria
-
 Angola
-
 Argentina
-
 Armenia
-
 Australia
-
 Austria
-
 Azerbaijan
-
 Bahamas
-
 Bahrain
-
 Bangladesh
-
 Belarus
-
 Belgium
-
 Bolivia
-
 Botswana
-
 Brazil
-
 Brunei
-
 Bulgaria
-
 Cambodia
-
 Cameroon
-
 Canada
-
 Chile
Chile
-
 China
China
-
 Colombia
-
 Congo
Congo
-
 Costa Rica
-
 Cote d'Ivoire
-
 Croatia
-
 Cuba
Cuba
-
 Cyprus
-
 Czechia
-
 DR Congo
-
 Denmark
-
 Dominican Republic
-
 Ecuador
-
 Egypt
Egypt
-
 El Salvador
-
 Estonia
-
 Eswatini
-
 Ethiopia
-
 Finland
-
 France
-
 Georgia
-
 Germany
-
 Ghana
Ghana
-
 Greece
-
 Haiti
Haiti
-
 Hong Kong
-
 Hungary
-
 India
India
-
 Indonesia
-
 Iran, Islamic republic
-
 Iraq
Iraq
-
 Ireland
-
 Israel
-
 Italy
Italy
-
 Jamaica
-
 Japan
Japan
-
 Jordan
-
 Kazakhstan
-
 Kenya
Kenya
-
 Korea
Korea
-
 Kuwait
-
 Kyrgyzstan
-
 Laos
Laos
-
 Latvia
-
 Lebanon
-
 Lesotho
-
 Libya
Libya
-
 Lithuania
-
 Luxembourg
-
 Madagascar
-
 Malaysia
-
 Malta
Malta
-
 Mauritius
-
 Mexico
-
 Moldova
-
 Mongolia
-
 Montenegro
-
 Morocco
-
 Mozambique
-
 Myanmar
-
 Namibia
-
 Nepal
Nepal
-
 Netherlands
-
 New Zealand
-
 Nigeria
-
 North Macedonia
-
 Norway
-
 Oman
Oman
-
 Pakistan
-
 Palestine
-
 Panama
-
 Papua New Guinea
-
 Paraguay
-
 Peru
Peru
-
 Philippines
-
 Poland
-
 Portugal
-
 Puerto Rico
-
 Qatar
Qatar
-
 Reunion
-
 Romania
-
 Rwanda
-
 Saudi Arabia
-
 Serbia
-
 Singapore
-
 Slovakia
-
 Slovenia
-
 Somalia
-
 South Africa
-
 Spain
Spain
-
 Sri Lanka
-
 Sweden
-
 Switzerland
-
 Syria
Syria
-
 Taiwan
-
 Tajikistan
-
 Tanzania
-
 Thailand
-
 Trinidad and Tobago
-
 Tunisia
-
 Turkey
-
 UAE
UAE
-
 Uganda
-
 Ukraine
-
 United Kingdom
-
United States
-
 Uruguay
-
 Uzbekistan
-
 Venezuela
-
 Vietnam
-
 Yemen
Yemen
-
 Zambia
-
 Zimbabwe
- Forex
- Crypto
