
WTI crude oil tests $58 as geopolitical risk clashes with bearish structure

WTI crude oil is trading in a tense holding pattern, with prices hovering near the $58 per barrel area on Friday after a sharp two-session rebound. Friday’s move toward $58.3 followed a gain of more than 3% the previous session, the strongest daily advance in months, as geopolitical risk abruptly re-entered the pricing equation.
Highlights
- WTI crude rebounds toward $58 on geopolitical risk but remains locked in a broader downtrend.
- Daily charts show oil capped below key moving averages, keeping rallies vulnerable.
- Oversupply forecasts and mixed demand outlook limit upside unless resistance breaks.
U.S. warnings of a potential “hard” response to unrest linked to Iran, renewed sanctions pressure on buyers of discounted Russian barrels, and continued U.S. efforts to curb Venezuelan oil flows all contributed to a short-term risk premium. Yet this rally has unfolded against an uncomfortable backdrop. The broader oil market remains weighed down by structural oversupply concerns and a market narrative that still leans bearish beyond headline-driven spikes. The result is a classic tug-of-war: short-term, fear-driven buying colliding with longer-term skepticism about demand and production balance.
Technical structure keeps the bearish bias intact
From a technical perspective, the daily chart continues to argue caution. WTI remains below all major exponential moving averages, including the 20-day, 50-day, 100-day, and the more influential 200-day EMA, which sits in the mid-$60s region. That configuration signals a market that is still trending lower on a medium- to long-term basis, even as short-term rallies emerge.
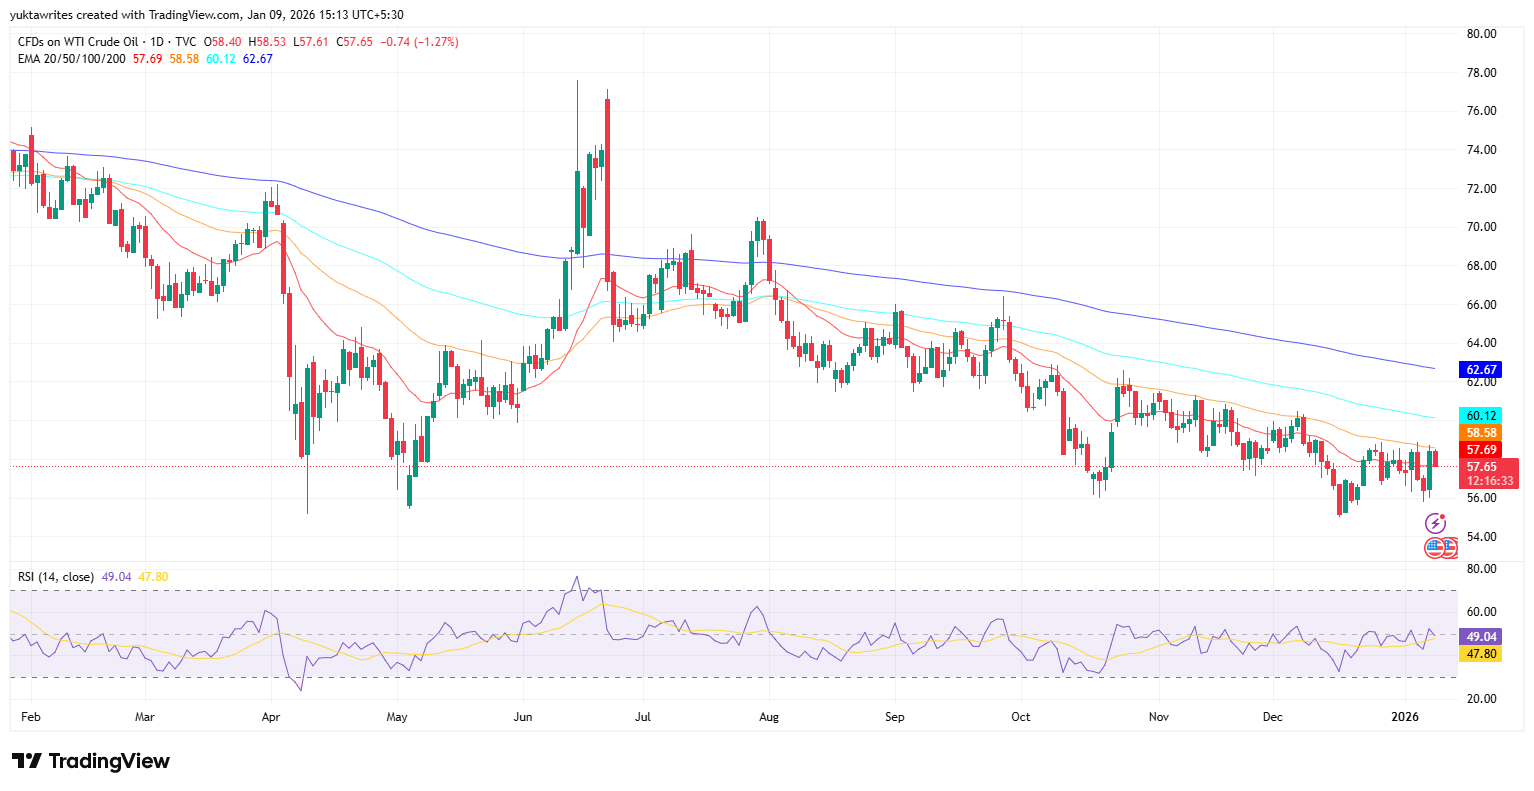
WTI crude oil price dynamics (Source: TradingView)
Momentum indicators reinforce this view. The daily RSI is hovering just below the midpoint near 49, reflecting balance rather than trend strength. In past cycles, durable oil rallies have required RSI to hold above 55 and expand, a condition that has not yet been met. Recent highs in the upper $58 have repeatedly acted as resistance, suggesting sellers remain active on strength.
Intraday charts add further nuance. On the 30-minute timeframe, Supertrend and parabolic SAR indicators have flipped back and forth around the $57.8 to $58.5 zone, highlighting indecision rather than conviction. The most recent pullback into the close, with SAR dots sitting above price, signals that short-term control has tilted back toward sellers. For active traders, that structure argues for respecting resistance until price can reclaim recent highs with authority.
Fundamentals split the market into two camps
The fundamental picture explains why oil struggles to trend decisively. On the bearish side, oversupply remains the dominant concern. Multiple analyst surveys and institutional forecasts point to ample global crude supply through 2026, with average WTI prices expected to remain below $60 and some scenarios projecting a drift into the low $50s if production continues to outpace demand. Rising inventories and resilient output from non-OPEC producers reinforce this pressure.
At the same time, geopolitical risk refuses to fade. Tensions involving Iran, Venezuela, and enforcement of sanctions on Russian exports introduce uncertainty around actual supply flows. While much of this risk has yet to translate into meaningful, sustained disruptions, it is enough to prevent oil from collapsing toward deeper bearish targets. Traders remain wary of being caught short during sudden headline-driven spikes.
Demand signals offer mixed guidance. OPEC continues to project solid consumption growth, suggesting the market could tighten if supply discipline improves. Meanwhile, the International Energy Agency has modestly trimmed surplus forecasts and raised demand growth estimates, hinting that the oversupply may be less severe than previously feared. These nuances help explain why selling pressure eases on dips, even as rallies struggle to extend.
Key levels define the next move
From a trading standpoint, the roadmap is clear. On the upside, WTI must achieve a sustained daily close above the $58.5 to $59 resistance zone to shift near-term bias toward a rally attempt. Success there would open the door to the low $60, with the next major test near the 100-day EMA around $60 to $61. A move above the 200-day EMA in the mid-$60s would be required to change the broader narrative, a scenario that currently depends on either a major supply shock or a meaningful tightening in balances.
On the downside, repeated failure near resistance keeps pressure on support. A slide back toward $56 would be unsurprising, and a decisive break below $55 would refocus attention on the multi-month lows near $53. Loss of that zone would likely confirm another leg lower in the dominant downtrend.
As previously discussed, WTI crude has spent much of the past year trading under the weight of oversupply expectations, with geopolitical rallies repeatedly fading once immediate risks subside. That pattern remains intact. While short-term shocks can lift prices sharply, the market has consistently demanded confirmation through sustained supply disruption or tighter inventories before rewarding bullish positions. Until that changes, oil remains vulnerable to selling on strength rather than building a durable uptrend.


Latest WTI News


-
 Afghanistan
-
 Albania
-
 Algeria
-
 Angola
-
 Argentina
-
 Armenia
-
 Australia
-
 Austria
-
 Azerbaijan
-
 Bahamas
-
 Bahrain
-
 Bangladesh
-
 Belarus
-
 Belgium
-
 Bolivia
-
 Botswana
-
 Brazil
-
 Brunei
-
 Bulgaria
-
 Cambodia
-
 Cameroon
-
 Canada
-
 Chile
Chile
-
 China
China
-
 Colombia
-
 Congo
Congo
-
 Costa Rica
-
 Cote d'Ivoire
-
 Croatia
-
 Cuba
Cuba
-
 Cyprus
-
 Czechia
-
 DR Congo
-
 Denmark
-
 Dominican Republic
-
 Ecuador
-
 Egypt
Egypt
-
 El Salvador
-
 Estonia
-
 Eswatini
-
 Ethiopia
-
 Finland
-
 France
-
 Georgia
-
 Germany
-
 Ghana
Ghana
-
 Greece
-
 Haiti
Haiti
-
 Hong Kong
-
 Hungary
-
 India
India
-
 Indonesia
-
 Iran, Islamic republic
-
 Iraq
Iraq
-
 Ireland
-
 Israel
-
 Italy
Italy
-
 Jamaica
-
 Japan
Japan
-
 Jordan
-
 Kazakhstan
-
 Kenya
Kenya
-
 Korea
Korea
-
 Kuwait
-
 Kyrgyzstan
-
 Laos
Laos
-
 Latvia
-
 Lebanon
-
 Lesotho
-
 Libya
Libya
-
 Lithuania
-
 Luxembourg
-
 Madagascar
-
 Malaysia
-
 Malta
Malta
-
 Mauritius
-
 Mexico
-
 Moldova
-
 Mongolia
-
 Montenegro
-
 Morocco
-
 Mozambique
-
 Myanmar
-
 Namibia
-
 Nepal
Nepal
-
 Netherlands
-
 New Zealand
-
 Nigeria
-
 North Macedonia
-
 Norway
-
 Oman
Oman
-
 Pakistan
-
 Palestine
-
 Panama
-
 Papua New Guinea
-
 Paraguay
-
 Peru
Peru
-
 Philippines
-
 Poland
-
 Portugal
-
 Puerto Rico
-
 Qatar
Qatar
-
 Reunion
-
 Romania
-
 Rwanda
-
 Saudi Arabia
-
 Serbia
-
 Singapore
-
 Slovakia
-
 Slovenia
-
 Somalia
-
 South Africa
-
 Spain
Spain
-
 Sri Lanka
-
 Sweden
-
 Switzerland
-
 Syria
Syria
-
 Taiwan
-
 Tajikistan
-
 Tanzania
-
 Thailand
-
 Trinidad and Tobago
-
 Tunisia
-
 Turkey
-
 UAE
UAE
-
 Uganda
-
 Ukraine
-
 United Kingdom
-
United States
-
 Uruguay
-
 Uzbekistan
-
 Venezuela
-
 Vietnam
-
 Yemen
Yemen
-
 Zambia
-
 Zimbabwe
- Forex
- Crypto
