
Intel stock drops 3.23% after volatile session despite bullish technical setup

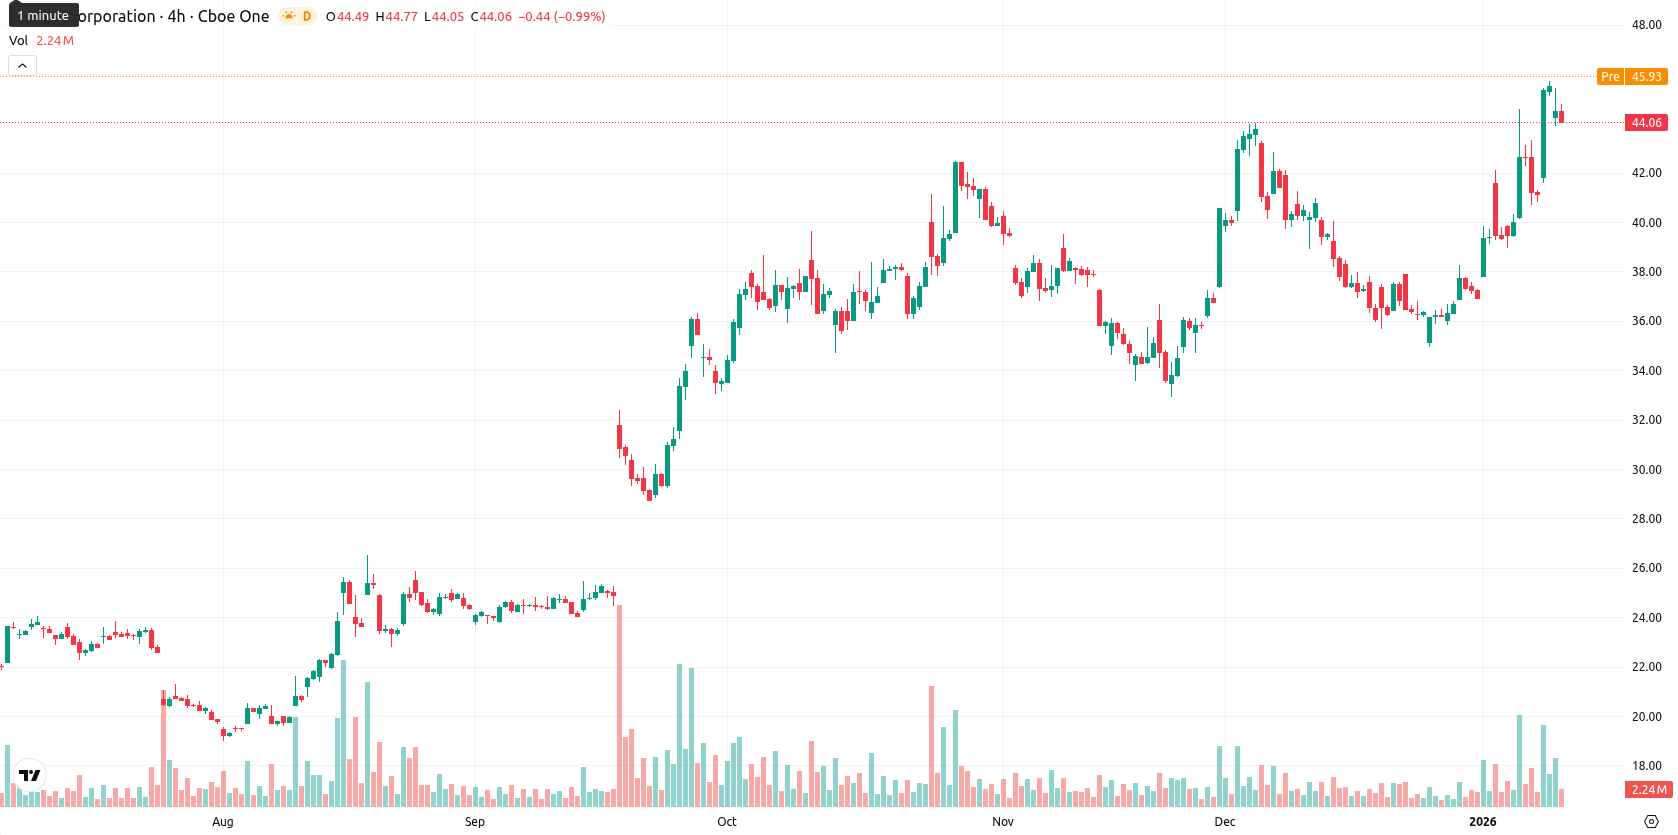
Intel Corporation (INTC) is trading at $44.08, having declined 3.23% on the session and holding above its MA-20 ($38.50), MA-50 ($38.35), and MA-200 ($28.06), which highlights a robust moving average structure with positive short-, medium-, and long-term momentum.
Highlights
- Intel secured an $8.9 billion investment under the CHIPS and Science Act, resulting in a 10% U.S. government stake at $20.47 per share.
- The Panther Lake processor, built on Intel’s advanced 18A manufacturing process, launched at CES 2026, driving renewed attention to the stock.
- Quarterly revenue surged 15% due to strong demand for data center solutions and AI accelerators, with a key earnings release scheduled for January 22, 2026.
Strategic investments and product launches drive positive sentiment
Intel recently received an $8.9 billion investment from the U.S. government under the CHIPS and Science Act, resulting in a 10% government stake at $20.47 per share. The stock has also benefited from the high-profile launch of its Panther Lake processor at CES 2026, based on the company's advanced 18A manufacturing process. Additional momentum stemmed from a 15% spike in quarterly revenue driven by demand for data center solutions and AI accelerators, as well as Intel's strategic partnership with Nvidia and forthcoming earnings release on January 22, 2026.
Short-term pullback as overbought signals counter bullish momentum
The next key dynamic support sits near the Ichimoku Kijun at $40.34, while resistance lies in the $45–46 range. Momentum signals are constructive on balance, with both the MACD and ADX on the daily and weekly timeframes showing a bullish bias. However, overbought signals from the RSI (65.05), Stochastic RSI (Strong Sell), CCI (179.66), and Bull/Bear Power (overbought, value 4.85) indicate upside exhaustion, while buyers still dominate intraday action. The Awesome Oscillator remains supportive of the uptrend. The stock opened with a slight gap down (open $44.75 vs previous close $45.55), currently trading near today's low ($44.06) and the session’s lower end, reflecting high volatility and pronounced selling pressure after the open. This intraday pullback diverges from the broadly positive momentum setup, warning of a short-term pause or retracement.
High upside odds as consolidation dominates weekly scenario
Looking ahead, the expected price range for the coming week is $42.00 to $46.50, reflecting typical volatility for a blue-chip name and the volatility band relative to current levels. The probability of a price increase is very high (more than 80%), while a decrease is less likely, based on the combined strength of bullish weekly and daily signals in RSI, ADX, MACD, and Moving Averages. The baseline scenario anticipates consolidation within the $42–$46.50 corridor. A bullish scenario would see the price clear resistance near $46.50 and advance further if buying resumes, while a bearish scenario could develop if support at the Ichimoku Kijun ($40.34) fails, leading to a deeper retracement toward $42.00.
Previously it was reported that Intel Corporation is exhibiting strong bullish momentum, trading well above key moving averages with technical indicators such as MACD and ADX confirming sustained buyer strength. However, while support is seen near $40.34 and resistance around $46-$47, overbought signals from RSI and Stochastic RSI suggest short-term consolidation is possible before further upside.


Latest Intel News


-
 Afghanistan
-
 Albania
-
 Algeria
-
 Angola
-
 Argentina
-
 Armenia
-
 Australia
-
 Austria
-
 Azerbaijan
-
 Bahamas
-
 Bahrain
-
 Bangladesh
-
 Belarus
-
 Belgium
-
 Bolivia
-
 Botswana
-
 Brazil
-
 Brunei
-
 Bulgaria
-
 Cambodia
-
 Cameroon
-
 Canada
-
 Chile
Chile
-
 China
China
-
 Colombia
-
 Congo
Congo
-
 Costa Rica
-
 Cote d'Ivoire
-
 Croatia
-
 Cuba
Cuba
-
 Cyprus
-
 Czechia
-
 DR Congo
-
 Denmark
-
 Dominican Republic
-
 Ecuador
-
 Egypt
Egypt
-
 El Salvador
-
 Estonia
-
 Eswatini
-
 Ethiopia
-
 Finland
-
 France
-
 Georgia
-
 Germany
-
 Ghana
Ghana
-
 Greece
-
 Haiti
Haiti
-
 Hong Kong
-
 Hungary
-
 India
India
-
 Indonesia
-
 Iran, Islamic republic
-
 Iraq
Iraq
-
 Ireland
-
 Israel
-
 Italy
Italy
-
 Jamaica
-
 Japan
Japan
-
 Jordan
-
 Kazakhstan
-
 Kenya
Kenya
-
 Korea
Korea
-
 Kuwait
-
 Kyrgyzstan
-
 Laos
Laos
-
 Latvia
-
 Lebanon
-
 Lesotho
-
 Libya
Libya
-
 Lithuania
-
 Luxembourg
-
 Madagascar
-
 Malaysia
-
 Malta
Malta
-
 Mauritius
-
 Mexico
-
 Moldova
-
 Mongolia
-
 Montenegro
-
 Morocco
-
 Mozambique
-
 Myanmar
-
 Namibia
-
 Nepal
Nepal
-
 Netherlands
-
 New Zealand
-
 Nigeria
-
 North Macedonia
-
 Norway
-
 Oman
Oman
-
 Pakistan
-
 Palestine
-
 Panama
-
 Papua New Guinea
-
 Paraguay
-
 Peru
Peru
-
 Philippines
-
 Poland
-
 Portugal
-
 Puerto Rico
-
 Qatar
Qatar
-
 Reunion
-
 Romania
-
 Rwanda
-
 Saudi Arabia
-
 Serbia
-
 Singapore
-
 Slovakia
-
 Slovenia
-
 Somalia
-
 South Africa
-
 Spain
Spain
-
 Sri Lanka
-
 Sweden
-
 Switzerland
-
 Syria
Syria
-
 Taiwan
-
 Tajikistan
-
 Tanzania
-
 Thailand
-
 Trinidad and Tobago
-
 Tunisia
-
 Turkey
-
 UAE
UAE
-
 Uganda
-
 Ukraine
-
 United Kingdom
-
United States
-
 Uruguay
-
 Uzbekistan
-
 Venezuela
-
 Vietnam
-
 Yemen
Yemen
-
 Zambia
-
 Zimbabwe
- Forex
- Crypto
