
Market cap fall below $700B sends Intel stock lower by 4.3%

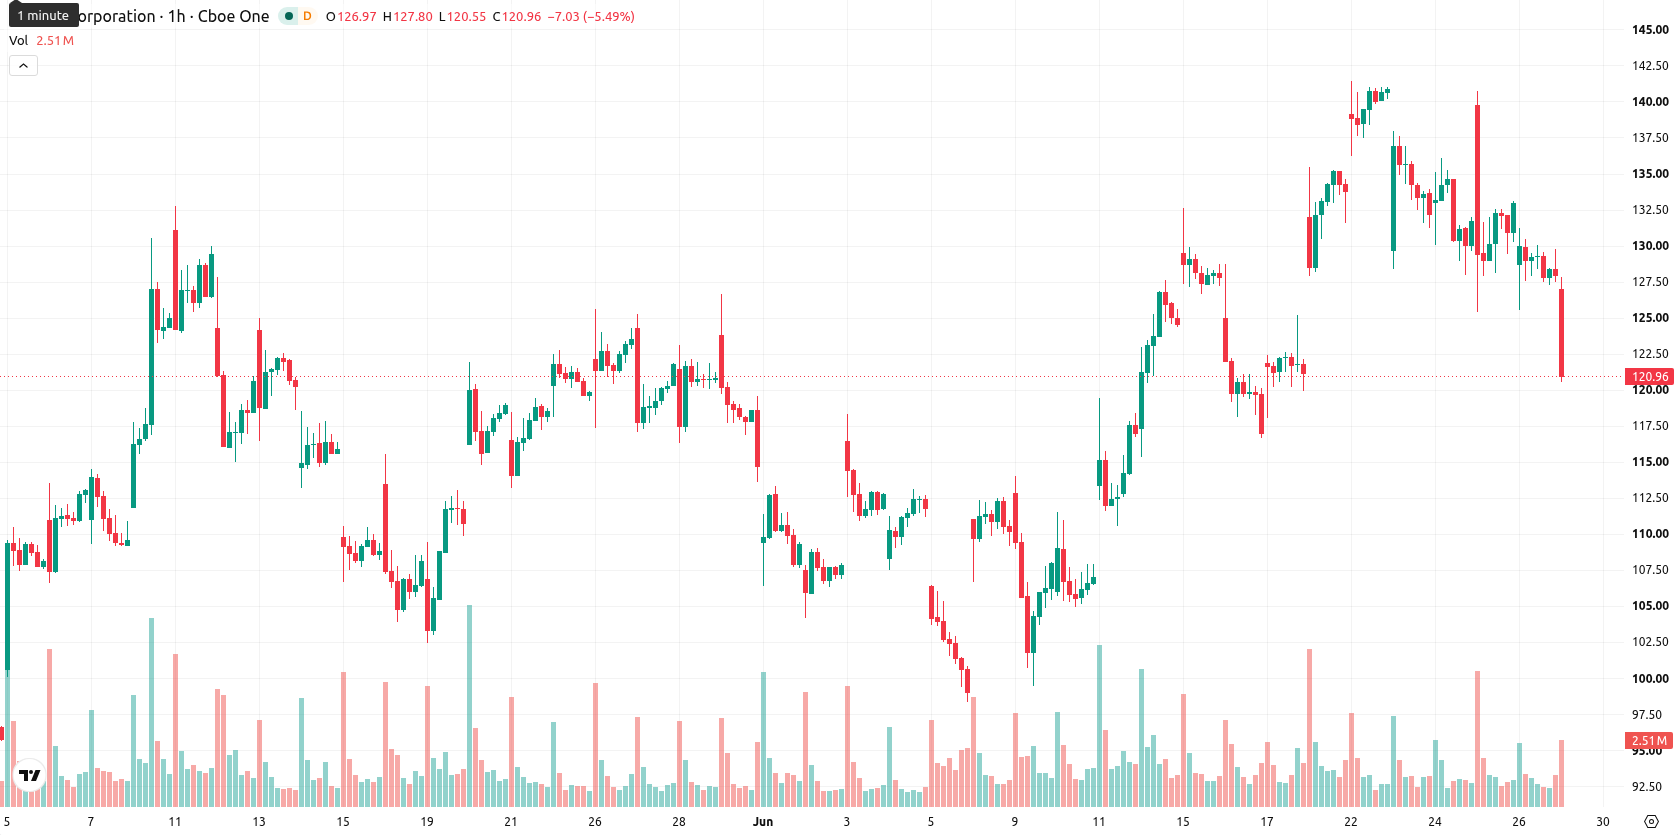
Intel (INTC) stock is trading at $121.95, down 4.3% for the day and ending near the session low. The stock is positioned below its key moving averages and has experienced elevated volatility amid recent selling pressure.
Highlights
- Apollon Wealth Management LLC increased its Intel stake by 19.7% in Q1, showing selective institutional confidence in the stock.
- Intel's market cap retreated under $700 billion, losing $66 billion from its 52-week high amid intensifying selling pressure.
- Technical signals remain bearish with strong selling momentum and volatility, projecting a 73% probability of price moving within the $115.1–$128.8 range.
Market cap contraction as institutions recalibrate holdings amid selling
Recent institutional activity saw Apollon Wealth Management LLC boost its position in Intel by 19.7% in the first quarter, reflecting a measured increase in demand for shares and potential portfolio confidence, according to Marketbeat. Meanwhile, Intel's market capitalization fell back below the $700 billion threshold, erasing $66 billion in value from its recent 52-week high, as reported by Ts2. These developments highlight ongoing changes in institutional allocation and mark a notable contraction in the company's market value against a backdrop of heightened selling pressure in the stock.
Bearish momentum confirmed as support holds but oscillators oversold
On the hourly chart, INTC is trading below the MA-20 at $129.99 and the MA-50 at $131.86, with the daily price remaining well above the MA-200 at $58.22. Immediate resistance is defined by the Ichimoku Kijun level at $131.97. Relative Strength Index (RSI) is at 34.43, indicating a sell signal, while Moving Average Convergence Divergence (MACD) also signals sell and the Average Directional Index (ADX) confirms a prevailing downward trend. The Stochastic RSI, Commodity Channel Index (CCI), and Bull/Bear Power (BBP) all reflect intraday oversold conditions or strong seller momentum. The Awesome Oscillator (AO) remains neutral and does not reinforce the current trend. Oversold oscillators suggest a possible short-term bounce, but broader technical momentum remains bearish.
Downside risk elevated as consolidation dominates short-term outlook
In the short term, INTC is expected to trade within a range of $115.1 to $128.8 amid ongoing volatility. The probability of an upward move is estimated at 27%, while a downward move is substantially more likely at 73%. The baseline scenario anticipates sideways consolidation within this corridor. A move above $131.97 could trigger additional gains, while a drop below $115.1 would likely signal further downside continuation.
Previously it was reported that Intel stock was exhibiting pronounced downside momentum and oversold technical conditions, raising short-term risk concerns. The latest data, highlighting sustained volatility and renewed institutional involvement, suggest that traders should closely monitor the $115.1 support level as further losses could accelerate if this threshold is breached.


-
 Afghanistan
-
 Albania
-
 Algeria
-
 Angola
-
 Argentina
-
 Armenia
-
 Australia
-
 Austria
-
 Azerbaijan
-
 Bahamas
-
 Bahrain
-
 Bangladesh
-
 Belarus
-
 Belgium
-
 Bolivia
-
 Botswana
-
 Brazil
-
 Brunei
-
 Bulgaria
-
 Cambodia
-
 Cameroon
-
 Canada
-
 Chile
Chile
-
 China
China
-
 Colombia
-
 Congo
Congo
-
 Costa Rica
-
 Cote d'Ivoire
-
 Croatia
-
 Cuba
Cuba
-
 Cyprus
-
 Czechia
-
 DR Congo
-
 Denmark
-
 Dominican Republic
-
 Ecuador
-
 Egypt
Egypt
-
 El Salvador
-
 Estonia
-
 Eswatini
-
 Ethiopia
-
 Finland
-
 France
-
 Georgia
-
 Germany
-
 Ghana
Ghana
-
 Greece
-
 Haiti
Haiti
-
 Hong Kong
-
 Hungary
-
 India
India
-
 Indonesia
-
 Iran, Islamic republic
-
 Iraq
Iraq
-
 Ireland
-
 Israel
-
 Italy
Italy
-
 Jamaica
-
 Japan
Japan
-
 Jordan
-
 Kazakhstan
-
 Kenya
Kenya
-
 Korea
Korea
-
 Kuwait
-
 Kyrgyzstan
-
 Laos
Laos
-
 Latvia
-
 Lebanon
-
 Lesotho
-
 Libya
Libya
-
 Lithuania
-
 Luxembourg
-
 Madagascar
-
 Malaysia
-
 Malta
Malta
-
 Mauritius
-
 Mexico
-
 Moldova
-
 Mongolia
-
 Montenegro
-
 Morocco
-
 Mozambique
-
 Myanmar
-
 Namibia
-
 Nepal
Nepal
-
 Netherlands
-
 New Zealand
-
 Nigeria
-
 North Macedonia
-
 Norway
-
 Oman
Oman
-
 Pakistan
-
 Palestine
-
 Panama
-
 Papua New Guinea
-
 Paraguay
-
 Peru
Peru
-
 Philippines
-
 Poland
-
 Portugal
-
 Puerto Rico
-
 Qatar
Qatar
-
 Reunion
-
 Romania
-
 Rwanda
-
 Saudi Arabia
-
 Serbia
-
 Singapore
-
 Slovakia
-
 Slovenia
-
 Somalia
-
 South Africa
-
 Spain
Spain
-
 Sri Lanka
-
 Sweden
-
 Switzerland
-
 Syria
Syria
-
 Taiwan
-
 Tajikistan
-
 Tanzania
-
 Thailand
-
 Trinidad and Tobago
-
 Tunisia
-
 Turkey
-
 UAE
UAE
-
 Uganda
-
 Ukraine
-
 United Kingdom
-
United States
-
 Uruguay
-
 Uzbekistan
-
 Venezuela
-
 Vietnam
-
 Yemen
Yemen
-
 Zambia
-
 Zimbabwe
- Forex
- Crypto
