
Apple stock consolidates as technical signals show oversold yet weak momentum

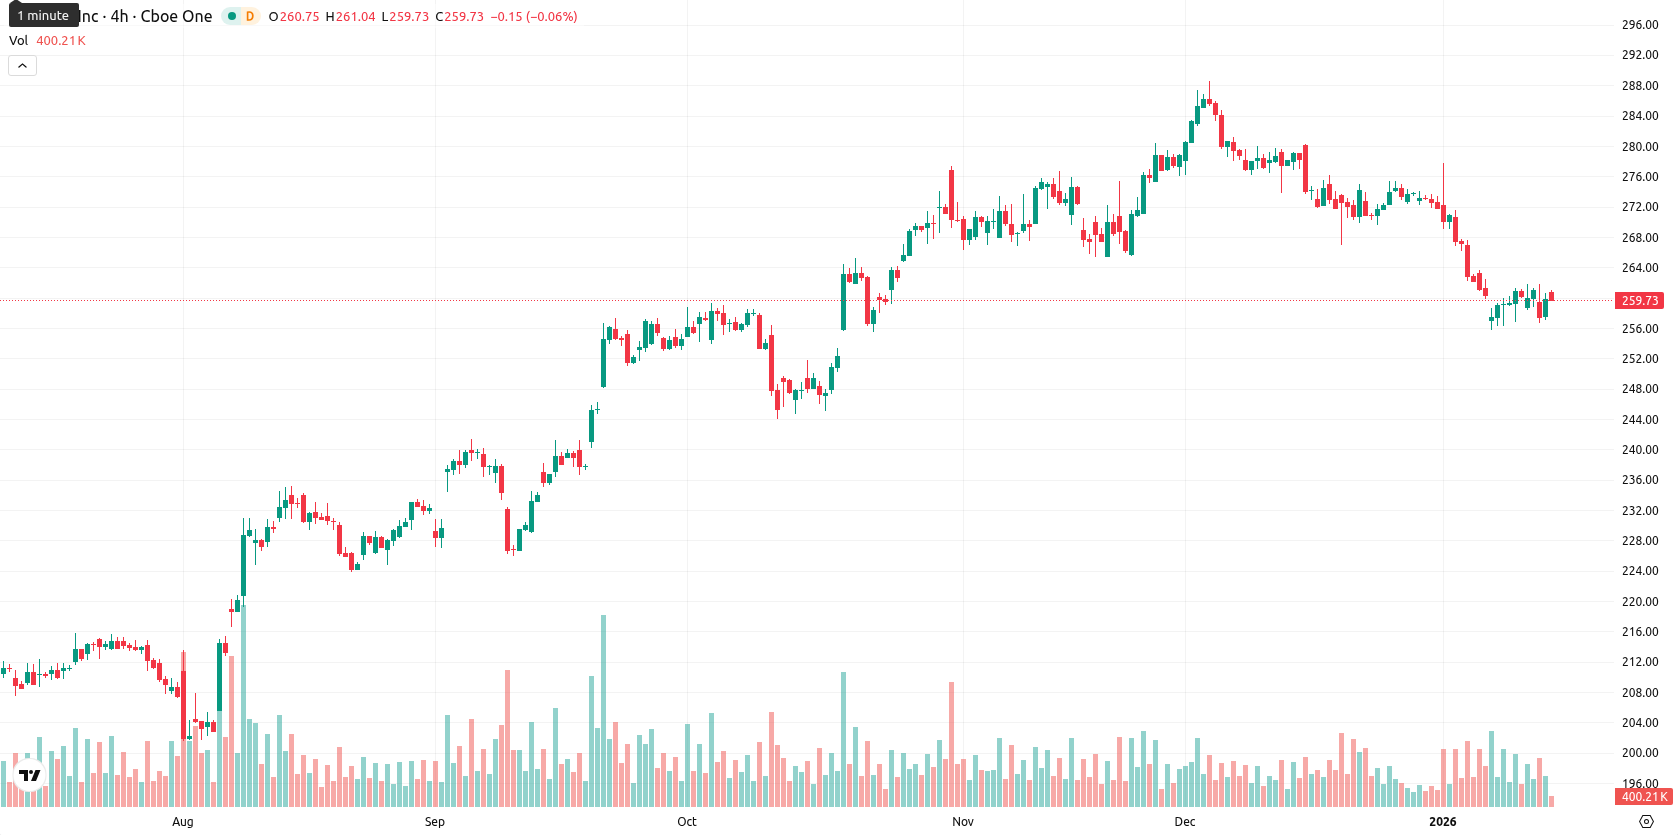
Apple Inc. (AAPL) is trading at $260.08, below both the MA-20 at $268.09 and MA-50 at $272.00, which points to ongoing short- and medium-term selling pressure. However, it remains comfortably above the MA-200 at $233.71, signaling a resilient longer-term floor.
Highlights
- Apple recently entered a multi-year deal with Google to integrate Gemini AI models into its cloud AI services, boosting features like Siri and Apple Intelligence.
- Apple returned over $100 billion to shareholders in 2025 through buybacks and dividends, maintaining a 13.92% dividend payout ratio and $1.04 annualized dividend per share.
- Regulatory scrutiny intensified as India issued a final warning regarding an ongoing antitrust probe, while Goldman Sachs reported losses tied to the future sale of Apple Card portfolio to JPMorgan Chase.
AI partnership and shareholder returns offset by regulatory pressures
Apple recently entered a multi-year deal with Google to integrate Gemini AI models into its cloud AI services, enhancing features like Siri and Apple Intelligence. The company returned over $100 billion to shareholders in 2025 through buybacks and dividends, maintaining a 13.92% dividend payout ratio and an annualized dividend of $1.04 per share. Regulatory scrutiny continues, as India issued a final warning related to an ongoing antitrust probe, while Goldman Sachs reported losses connected to the prospective sale of the Apple Card portfolio to JPMorgan Chase.
Capped price and weak momentum clash with mounting oversold signals
Technical signals show the price is capped beneath both its short-term MA-20 ($268.09) and medium-term MA-50 ($272.00) with persistent resistance around the Ichimoku Kijun at $267.92, while the MA-200 at $233.71 continues to underpin long-term support. MACD remains in sell territory and ADX is weak at 17.18, underscoring limited upside momentum. RSI at 30.78, Stochastic RSI, CCI, and Bull/Bear Power all point to oversold conditions, yet the Awesome Oscillator continues to highlight a bearish bias. Intraday action has been quiet, as AAPL trades near the midpoint of today’s $260.25 – $260.96 range in a sideways pattern, with a clear divergence between oversold oscillators and currently weak momentum.
Sideways bias set as bullish shift depends on key breakout
For the next five sessions, AAPL is expected to trade in a $253.00 to $263.00 price band, consistent with typical volatility relative to current levels. There is a moderate 75% probability of price appreciation, supported by major weekly trend signals showing underlying buy strength, although downside potential remains if the price closes below $253.00. The baseline outlook is for continued sideways movement, with confirmation of a bullish shift hinging on a sustained breakout above the $267.92 Kijun resistance. A downside scenario would open further losses toward long-term support near the MA-200 if $253.00 fails.
Last time, analysts noted that Apple was trading below its short- and medium-term moving averages, with technical signals indicating mixed momentum and persistent downside pressure despite support from long-term trends. Oscillators suggested oversold conditions and range-bound trading between key support and resistance levels, with potential for an upside breakout if immediate resistance is surpassed.


-
 Afghanistan
-
 Albania
-
 Algeria
-
 Angola
-
 Argentina
-
 Armenia
-
 Australia
-
 Austria
-
 Azerbaijan
-
 Bahamas
-
 Bahrain
-
 Bangladesh
-
 Belarus
-
 Belgium
-
 Bolivia
-
 Botswana
-
 Brazil
-
 Brunei
-
 Bulgaria
-
 Cambodia
-
 Cameroon
-
 Canada
-
 Chile
Chile
-
 China
China
-
 Colombia
-
 Congo
Congo
-
 Costa Rica
-
 Cote d'Ivoire
-
 Croatia
-
 Cuba
Cuba
-
 Cyprus
-
 Czechia
-
 DR Congo
-
 Denmark
-
 Dominican Republic
-
 Ecuador
-
 Egypt
Egypt
-
 El Salvador
-
 Estonia
-
 Eswatini
-
 Ethiopia
-
 Finland
-
 France
-
 Georgia
-
 Germany
-
 Ghana
Ghana
-
 Greece
-
 Haiti
Haiti
-
 Hong Kong
-
 Hungary
-
 India
India
-
 Indonesia
-
 Iran, Islamic republic
-
 Iraq
Iraq
-
 Ireland
-
 Israel
-
 Italy
Italy
-
 Jamaica
-
 Japan
Japan
-
 Jordan
-
 Kazakhstan
-
 Kenya
Kenya
-
 Korea
Korea
-
 Kuwait
-
 Kyrgyzstan
-
 Laos
Laos
-
 Latvia
-
 Lebanon
-
 Lesotho
-
 Libya
Libya
-
 Lithuania
-
 Luxembourg
-
 Madagascar
-
 Malaysia
-
 Malta
Malta
-
 Mauritius
-
 Mexico
-
 Moldova
-
 Mongolia
-
 Montenegro
-
 Morocco
-
 Mozambique
-
 Myanmar
-
 Namibia
-
 Nepal
Nepal
-
 Netherlands
-
 New Zealand
-
 Nigeria
-
 North Macedonia
-
 Norway
-
 Oman
Oman
-
 Pakistan
-
 Palestine
-
 Panama
-
 Papua New Guinea
-
 Paraguay
-
 Peru
Peru
-
 Philippines
-
 Poland
-
 Portugal
-
 Puerto Rico
-
 Qatar
Qatar
-
 Reunion
-
 Romania
-
 Rwanda
-
 Saudi Arabia
-
 Serbia
-
 Singapore
-
 Slovakia
-
 Slovenia
-
 Somalia
-
 South Africa
-
 Spain
Spain
-
 Sri Lanka
-
 Sweden
-
 Switzerland
-
 Syria
Syria
-
 Taiwan
-
 Tajikistan
-
 Tanzania
-
 Thailand
-
 Trinidad and Tobago
-
 Tunisia
-
 Turkey
-
 UAE
UAE
-
 Uganda
-
 Ukraine
-
 United Kingdom
-
United States
-
 Uruguay
-
 Uzbekistan
-
 Venezuela
-
 Vietnam
-
 Yemen
Yemen
-
 Zambia
-
 Zimbabwe
- Forex
- Crypto
