
Quantum Computing Inc. stock drops 3.04% as sellers dominate below MA-200 resistance

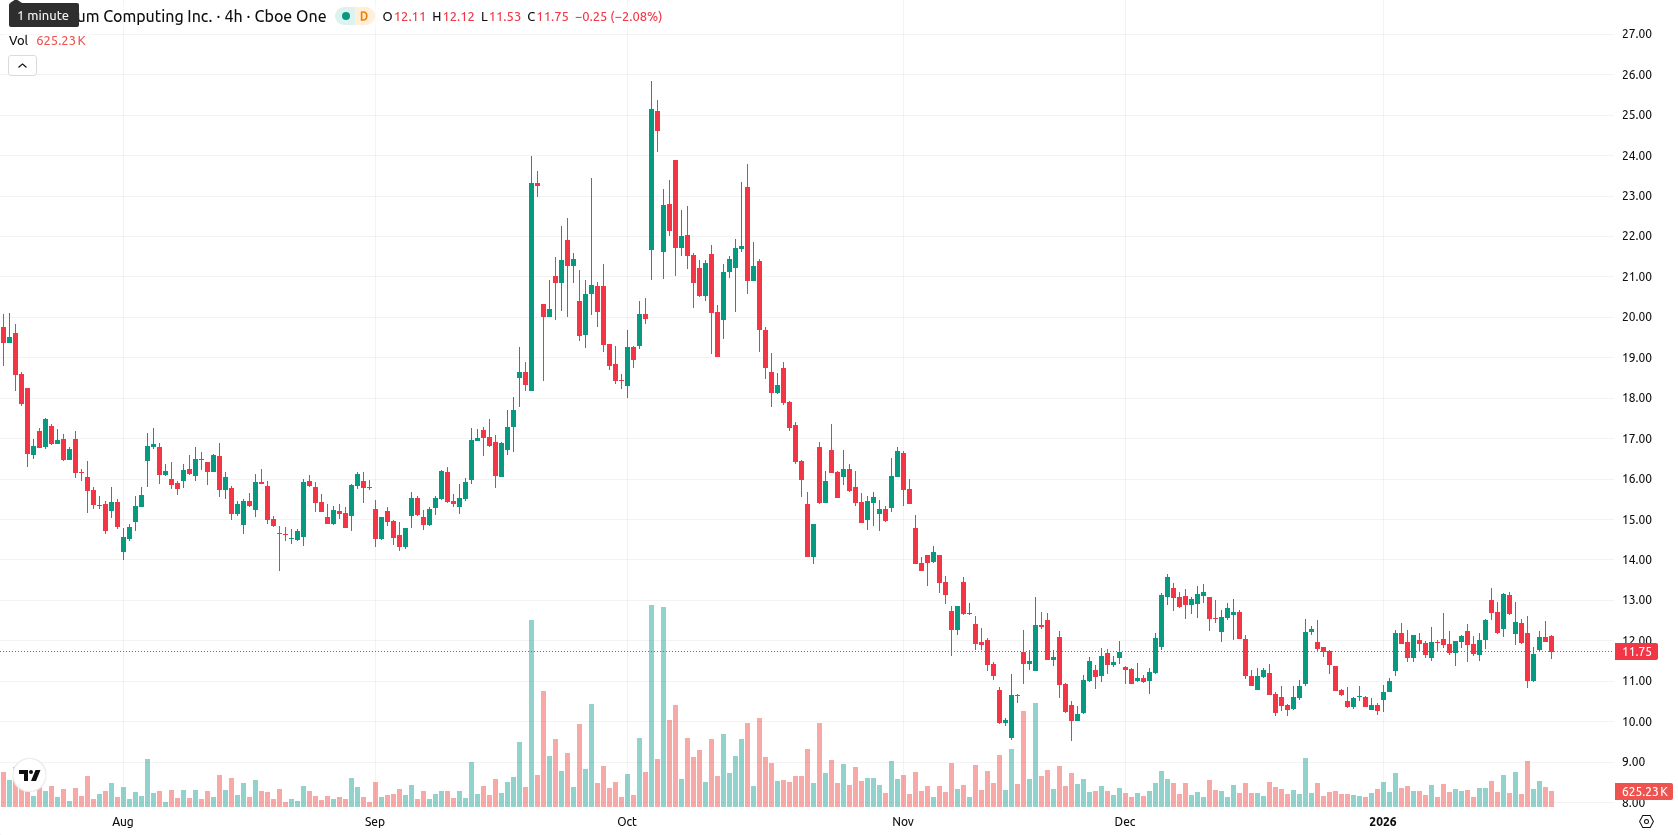
Quantum Computing Inc. (QUBT) is trading at $11.64 after falling 3.04% today, with the price sitting just above both the MA-20 and MA-50 at $11.61, indicating short-term stability. However, the asset remains well below the MA-200 at $14.15, confirming persistent long-term downside pressure, while the Ichimoku Kijun at $11.72 acts as immediate resistance.
Highlights
- QUBT is trading at $11.64, marginally above its MA-20 and MA-50 ($11.61), signaling short-term stability amid long-term downside pressure below MA-200 ($14.15).
- Immediate resistance is defined by the Ichimoku Kijun at $11.72, while support resides at the MA-50, with today’s price range between $11.54–$12.11 and a 3.04% drop.
- Bearish momentum prevails as oscillators indicate buyer exhaustion and a likely trading range of $11.20–$12.30 next week, with less than 20% probability of an upward move.
Mixed momentum signals as trend strength remains uncertain
Momentum signals are mixed for QUBT. The daily MACD shows a mild buy signal and the RSI is modestly bullish at 51.00, but the ADX remains weak at 10.66, indicating trend uncertainty. Intraday oscillators such as Stochastic RSI and CCI trend neutral to slightly bearish, while Bull/Bear Power is classified as overbought, hinting at short-term buyer exhaustion. Immediate resistance is set by the Ichimoku Kijun at $11.72, with the MA-50 as potential support if prices move lower.
Downside risk rises as technical barriers limit upside
QUBT will likely trade within a typical volatility band of $11.20 to $12.30 over the coming week. The probability of an upward move is low — less than 20% — as weekly Moving Averages, RSI, and MACD suggest increasing downside risk. Sideways movement between support at $11.20 and resistance near $12.00 – $12.30 is expected unless a firm close above the Ichimoku Kijun and MA-50 triggers a push beyond $12.30. A decisive break below $11.20 would expose QUBT to further short-term weakness.


Latest Quantum Computing News


-
 Afghanistan
-
 Albania
-
 Algeria
-
 Angola
-
 Argentina
-
 Armenia
-
 Australia
-
 Austria
-
 Azerbaijan
-
 Bahamas
-
 Bahrain
-
 Bangladesh
-
 Belarus
-
 Belgium
-
 Bolivia
-
 Botswana
-
 Brazil
-
 Brunei
-
 Bulgaria
-
 Cambodia
-
 Cameroon
-
 Canada
-
 Chile
Chile
-
 China
China
-
 Colombia
-
 Congo
Congo
-
 Costa Rica
-
 Cote d'Ivoire
-
 Croatia
-
 Cuba
Cuba
-
 Cyprus
-
 Czechia
-
 DR Congo
-
 Denmark
-
 Dominican Republic
-
 Ecuador
-
 Egypt
Egypt
-
 El Salvador
-
 Estonia
-
 Eswatini
-
 Ethiopia
-
 Finland
-
 France
-
 Georgia
-
 Germany
-
 Ghana
Ghana
-
 Greece
-
 Haiti
Haiti
-
 Hong Kong
-
 Hungary
-
 India
India
-
 Indonesia
-
 Iran, Islamic republic
-
 Iraq
Iraq
-
 Ireland
-
 Israel
-
 Italy
Italy
-
 Jamaica
-
 Japan
Japan
-
 Jordan
-
 Kazakhstan
-
 Kenya
Kenya
-
 Korea
Korea
-
 Kuwait
-
 Kyrgyzstan
-
 Laos
Laos
-
 Latvia
-
 Lebanon
-
 Lesotho
-
 Libya
Libya
-
 Lithuania
-
 Luxembourg
-
 Madagascar
-
 Malaysia
-
 Malta
Malta
-
 Mauritius
-
 Mexico
-
 Moldova
-
 Mongolia
-
 Montenegro
-
 Morocco
-
 Mozambique
-
 Myanmar
-
 Namibia
-
 Nepal
Nepal
-
 Netherlands
-
 New Zealand
-
 Nigeria
-
 North Macedonia
-
 Norway
-
 Oman
Oman
-
 Pakistan
-
 Palestine
-
 Panama
-
 Papua New Guinea
-
 Paraguay
-
 Peru
Peru
-
 Philippines
-
 Poland
-
 Portugal
-
 Puerto Rico
-
 Qatar
Qatar
-
 Reunion
-
 Romania
-
 Rwanda
-
 Saudi Arabia
-
 Serbia
-
 Singapore
-
 Slovakia
-
 Slovenia
-
 Somalia
-
 South Africa
-
 Spain
Spain
-
 Sri Lanka
-
 Sweden
-
 Switzerland
-
 Syria
Syria
-
 Taiwan
-
 Tajikistan
-
 Tanzania
-
 Thailand
-
 Trinidad and Tobago
-
 Tunisia
-
 Turkey
-
 UAE
UAE
-
 Uganda
-
 Ukraine
-
 United Kingdom
-
United States
-
 Uruguay
-
 Uzbekistan
-
 Venezuela
-
 Vietnam
-
 Yemen
Yemen
-
 Zambia
-
 Zimbabwe
- Forex
- Crypto
