
Quantum Computing stock: technical divergence confirms downside move and weak support drives losses

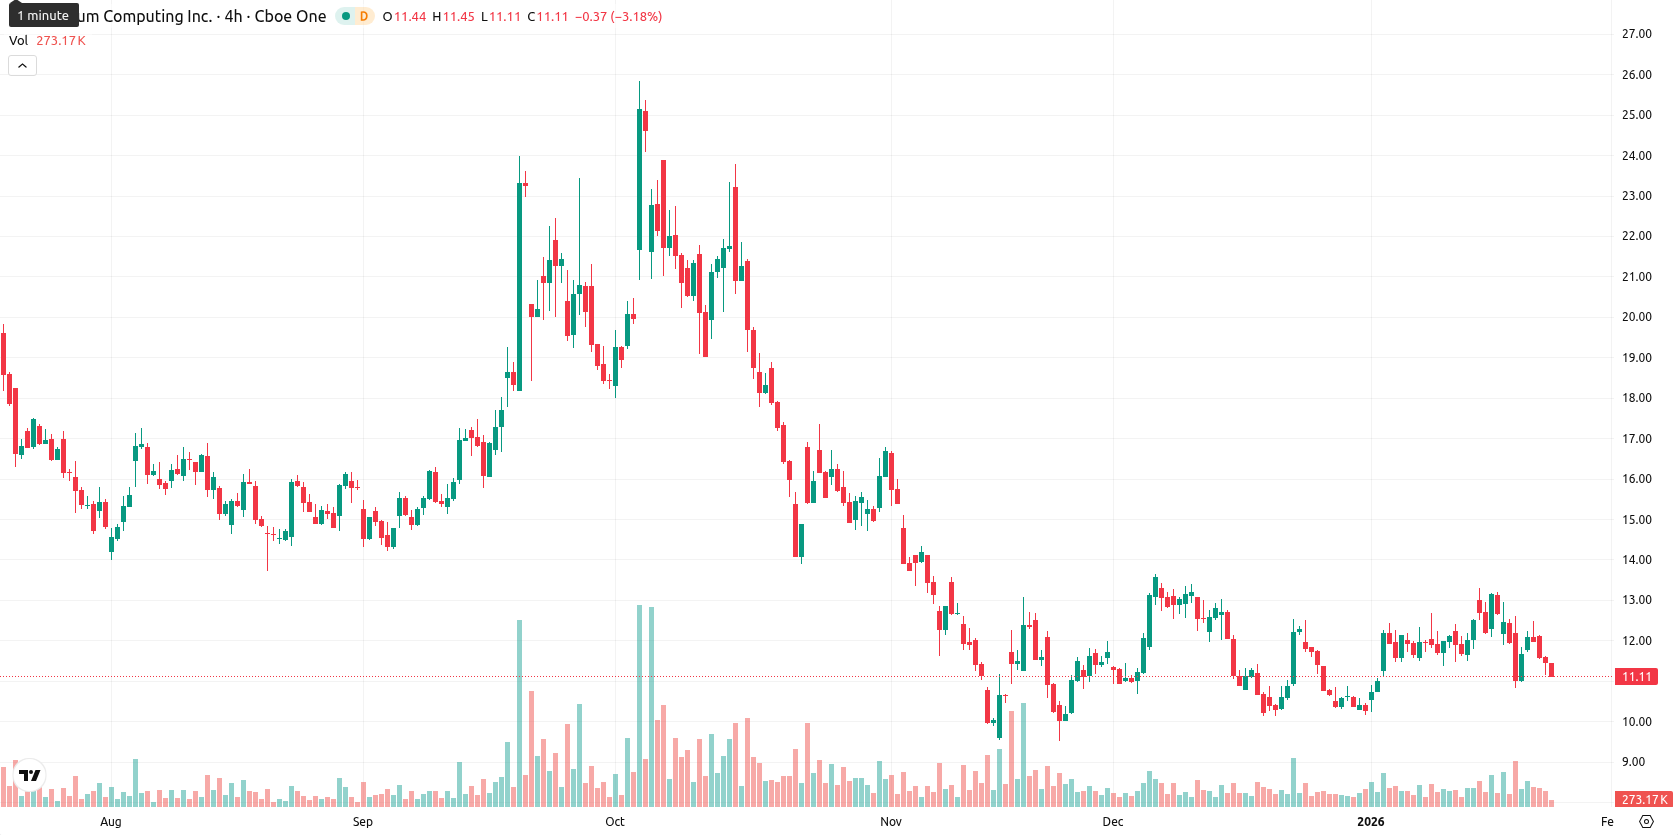
Quantum Computing Inc. (QUBT) is trading at $10.96, placing it below the MA-20 ($11.60), MA-50 ($11.59), and well below the MA-200 ($14.17), highlighting sustained seller pressure across short, medium, and long-term horizons. The $11.72 Ichimoku Kijun serves as the nearest dynamic resistance, with no significant immediate support in proximity.
Highlights
- QUBT is trading at $10.96, below the MA-20 ($11.60), MA-50 ($11.59), and MA-200 ($14.17), reflecting persistent selling across all timeframes.
- Technical indicators show high volatility and seller dominance; daily price dropped $0.50 (4.36%) and currently hovers near the intraday low.
- Expected trading range for the next five sessions is $9.90 to $11.20, with a less than 20% probability of price increase and consolidation favored.
Mixed momentum signals amid downside volatility and oversold readings
Momentum signals are mixed: the daily MACD shows a mild buy bias, but the ADX is weakly neutral at 10.26, indicating no clear trend strength. RSI at 47.15 supports a sell bias, while Stochastic RSI and Bull/Bear Power both register oversold conditions, signaling clear seller dominance after the open. The session price dropped $0.50 or 4.36%, with trading activity near today’s intraday low, reflecting high volatility and persistent downside pressure since the market opened. Daily oscillators show divergence, as oversold readings coincide with continued negative momentum and a downward move confirming seller control.
Further downside likely as range-bound outlook dominates
Over the next five sessions, the expected trading range for QUBT is set between $9.90 and $11.20, aligning with its typical volatility band relative to current levels. The probability of a price increase remains very low (less than 20%), so further downside is the more probable scenario. In the baseline outlook, QUBT will likely consolidate between $9.90 and $11.20, while a sustained move above $11.20 could prompt a retest of resistance, and a drop below $9.90 would signal a renewed bearish wave.
The latest analysis indicates that Quantum Computing Inc. (QUBT) remains under both short- and long-term selling pressure, with the price trading below key moving averages and near the lower end of today’s range following moderate volatility. Oscillator and momentum signals are mixed, with some indicators showing oversold conditions but overall trend strength lacking, while immediate technical levels to watch include support near the Ichimoku Kijun and resistance at the MA-50 and $12.00 zone.


Latest Quantum Computing News


-
 Afghanistan
-
 Albania
-
 Algeria
-
 Angola
-
 Argentina
-
 Armenia
-
 Australia
-
 Austria
-
 Azerbaijan
-
 Bahamas
-
 Bahrain
-
 Bangladesh
-
 Belarus
-
 Belgium
-
 Bolivia
-
 Botswana
-
 Brazil
-
 Brunei
-
 Bulgaria
-
 Cambodia
-
 Cameroon
-
 Canada
-
 Chile
Chile
-
 China
China
-
 Colombia
-
 Congo
Congo
-
 Costa Rica
-
 Cote d'Ivoire
-
 Croatia
-
 Cuba
Cuba
-
 Cyprus
-
 Czechia
-
 DR Congo
-
 Denmark
-
 Dominican Republic
-
 Ecuador
-
 Egypt
Egypt
-
 El Salvador
-
 Estonia
-
 Eswatini
-
 Ethiopia
-
 Finland
-
 France
-
 Georgia
-
 Germany
-
 Ghana
Ghana
-
 Greece
-
 Haiti
Haiti
-
 Hong Kong
-
 Hungary
-
 India
India
-
 Indonesia
-
 Iran, Islamic republic
-
 Iraq
Iraq
-
 Ireland
-
 Israel
-
 Italy
Italy
-
 Jamaica
-
 Japan
Japan
-
 Jordan
-
 Kazakhstan
-
 Kenya
Kenya
-
 Korea
Korea
-
 Kuwait
-
 Kyrgyzstan
-
 Laos
Laos
-
 Latvia
-
 Lebanon
-
 Lesotho
-
 Libya
Libya
-
 Lithuania
-
 Luxembourg
-
 Madagascar
-
 Malaysia
-
 Malta
Malta
-
 Mauritius
-
 Mexico
-
 Moldova
-
 Mongolia
-
 Montenegro
-
 Morocco
-
 Mozambique
-
 Myanmar
-
 Namibia
-
 Nepal
Nepal
-
 Netherlands
-
 New Zealand
-
 Nigeria
-
 North Macedonia
-
 Norway
-
 Oman
Oman
-
 Pakistan
-
 Palestine
-
 Panama
-
 Papua New Guinea
-
 Paraguay
-
 Peru
Peru
-
 Philippines
-
 Poland
-
 Portugal
-
 Puerto Rico
-
 Qatar
Qatar
-
 Reunion
-
 Romania
-
 Rwanda
-
 Saudi Arabia
-
 Serbia
-
 Singapore
-
 Slovakia
-
 Slovenia
-
 Somalia
-
 South Africa
-
 Spain
Spain
-
 Sri Lanka
-
 Sweden
-
 Switzerland
-
 Syria
Syria
-
 Taiwan
-
 Tajikistan
-
 Tanzania
-
 Thailand
-
 Trinidad and Tobago
-
 Tunisia
-
 Turkey
-
 UAE
UAE
-
 Uganda
-
 Ukraine
-
 United Kingdom
-
United States
-
 Uruguay
-
 Uzbekistan
-
 Venezuela
-
 Vietnam
-
 Yemen
Yemen
-
 Zambia
-
 Zimbabwe
- Forex
- Crypto
