
Bullish technical setup and momentum signals — Nano Dimension stock gains 3.76%

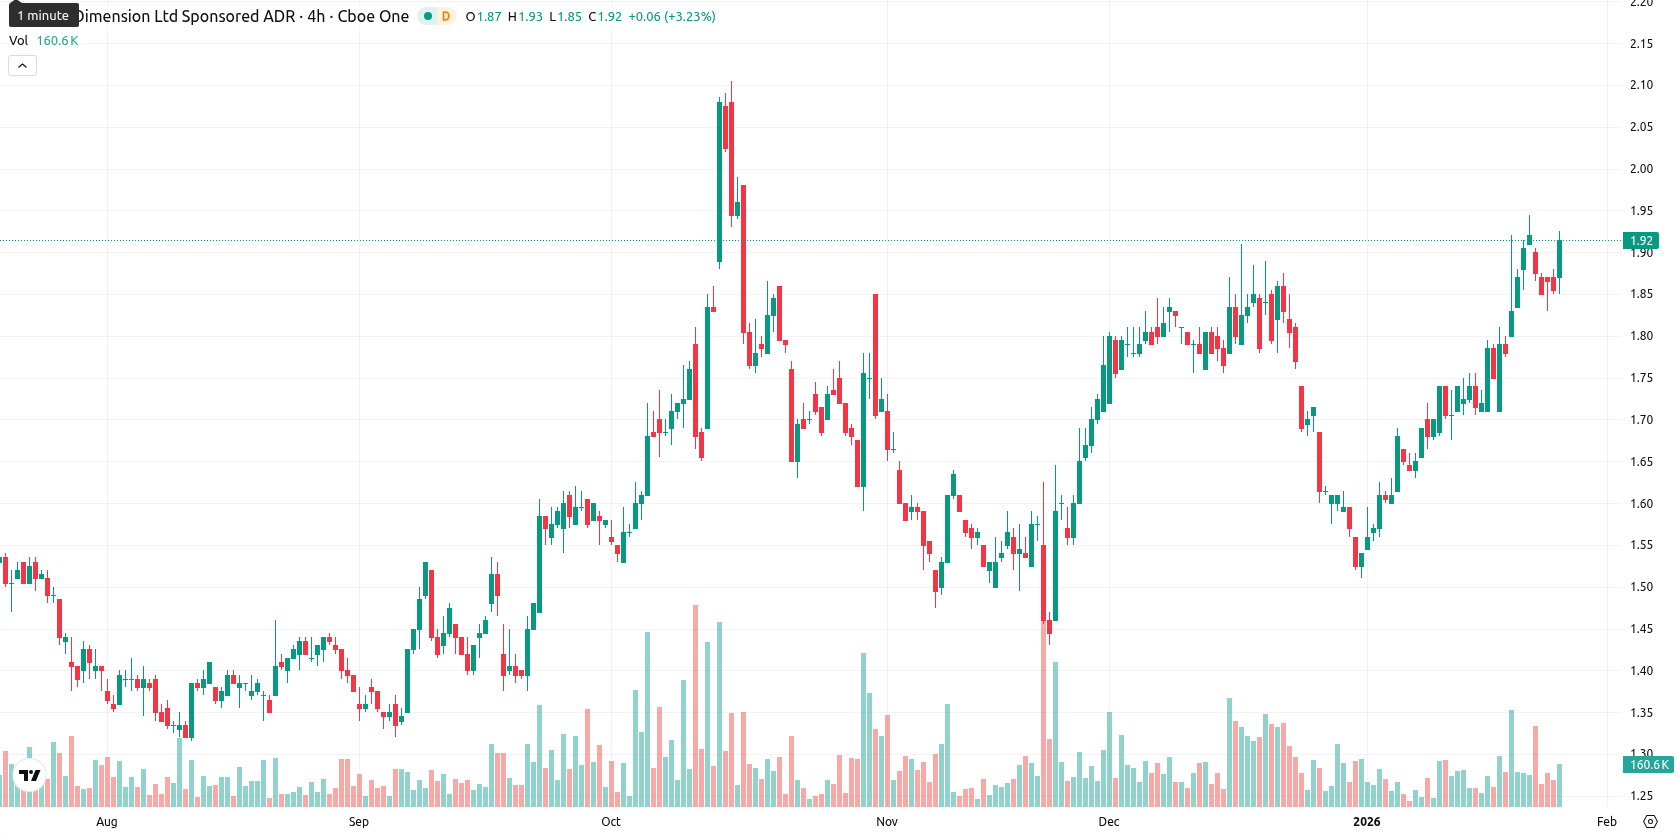
Nano Dimension Ltd (NNDM) is trading at $1.93, which is well above the MA-20 ($1.70), MA-50 ($1.71), and MA-200 ($1.58), confirming a bullish structure across short-, medium-, and long-term timeframes.
Highlights
- NNDM is trading at $1.93, well above the MA-20 ($1.70), MA-50 ($1.71), and MA-200 ($1.58), confirming a bullish structure across all timeframes.
- Momentum indicators MACD and RSI give Buy signals, while ADX is neutral and overbought readings from Stochastic RSI and CCI suggest some caution.
- Support is identified around $1.73 (Kijun), with price expected to consolidate in the $1.75–$2.00 range, and a break over $2.00 could spur further gains.
Moderate volatility as positive momentum faces overbought risks
The nearest dynamic support is indicated by the Ichimoku Kijun at $1.73, while the next resistance is likely around the MA-50 at $1.71 or the next round level above the current price. Momentum signals are positive, with a Buy forecast from both the MACD and RSI on the daily chart, while the ADX remains neutral at relatively low levels, indicating the trend is not yet strongly established. The Stochastic RSI and Commodity Channel Index show some overbought conditions, but Bull/Bear Power favors buyers intraday. There was a narrow gap at the open (from $1.86 to $1.87), and the price is now near today’s high, suggesting moderate volatility and persistent strength toward the upper end of today’s range. The Awesome Oscillator supports the bullish tone, though overbought indicators and low ADX suggest some caution as oscillators and momentum are not fully aligned.
High upside probability as consolidation anchors short-term outlook
For the coming five sessions, the expected price range is $1.75 – $2.12, reflecting recent volatility and forming a typical volatility band relative to current levels. The probability of a price increase is high (more than 80%) based on the strong buy signals from the weekly Moving Averages, MACD, and RSI, making a decline much less likely in the short term. The baseline scenario sees the price consolidating above support between $1.75 and $2.00. In a bullish scenario, a clear break above $2.00 could drive further gains, while a bearish reversal might test the $1.75 – $1.80 support zone.
Last time, analysts noted that Nano Dimension Ltd is trading above key moving averages, indicating a persistent bullish bias across short-, medium-, and long-term timeframes, with momentum signals remaining moderately positive despite weak overall trend strength. However, technical indicators reflect overbought conditions and highlight a likely near-term consolidation between dynamic support at $1.73 and resistance at $2.00 unless momentum triggers a breakout.


Latest Nano Dimension News


-
 Afghanistan
-
 Albania
-
 Algeria
-
 Angola
-
 Argentina
-
 Armenia
-
 Australia
-
 Austria
-
 Azerbaijan
-
 Bahamas
-
 Bahrain
-
 Bangladesh
-
 Belarus
-
 Belgium
-
 Bolivia
-
 Botswana
-
 Brazil
-
 Brunei
-
 Bulgaria
-
 Cambodia
-
 Cameroon
-
 Canada
-
 Chile
Chile
-
 China
China
-
 Colombia
-
 Congo
Congo
-
 Costa Rica
-
 Cote d'Ivoire
-
 Croatia
-
 Cuba
Cuba
-
 Cyprus
-
 Czechia
-
 DR Congo
-
 Denmark
-
 Dominican Republic
-
 Ecuador
-
 Egypt
Egypt
-
 El Salvador
-
 Estonia
-
 Eswatini
-
 Ethiopia
-
 Finland
-
 France
-
 Georgia
-
 Germany
-
 Ghana
Ghana
-
 Greece
-
 Haiti
Haiti
-
 Hong Kong
-
 Hungary
-
 India
India
-
 Indonesia
-
 Iran, Islamic republic
-
 Iraq
Iraq
-
 Ireland
-
 Israel
-
 Italy
Italy
-
 Jamaica
-
 Japan
Japan
-
 Jordan
-
 Kazakhstan
-
 Kenya
Kenya
-
 Korea
Korea
-
 Kuwait
-
 Kyrgyzstan
-
 Laos
Laos
-
 Latvia
-
 Lebanon
-
 Lesotho
-
 Libya
Libya
-
 Lithuania
-
 Luxembourg
-
 Madagascar
-
 Malaysia
-
 Malta
Malta
-
 Mauritius
-
 Mexico
-
 Moldova
-
 Mongolia
-
 Montenegro
-
 Morocco
-
 Mozambique
-
 Myanmar
-
 Namibia
-
 Nepal
Nepal
-
 Netherlands
-
 New Zealand
-
 Nigeria
-
 North Macedonia
-
 Norway
-
 Oman
Oman
-
 Pakistan
-
 Palestine
-
 Panama
-
 Papua New Guinea
-
 Paraguay
-
 Peru
Peru
-
 Philippines
-
 Poland
-
 Portugal
-
 Puerto Rico
-
 Qatar
Qatar
-
 Reunion
-
 Romania
-
 Rwanda
-
 Saudi Arabia
-
 Serbia
-
 Singapore
-
 Slovakia
-
 Slovenia
-
 Somalia
-
 South Africa
-
 Spain
Spain
-
 Sri Lanka
-
 Sweden
-
 Switzerland
-
 Syria
Syria
-
 Taiwan
-
 Tajikistan
-
 Tanzania
-
 Thailand
-
 Trinidad and Tobago
-
 Tunisia
-
 Turkey
-
 UAE
UAE
-
 Uganda
-
 Ukraine
-
 United Kingdom
-
United States
-
 Uruguay
-
 Uzbekistan
-
 Venezuela
-
 Vietnam
-
 Yemen
Yemen
-
 Zambia
-
 Zimbabwe
- Forex
- Crypto
