
-3.12% for Nano Dimension stock — bullish momentum cools beneath $2.00 cap

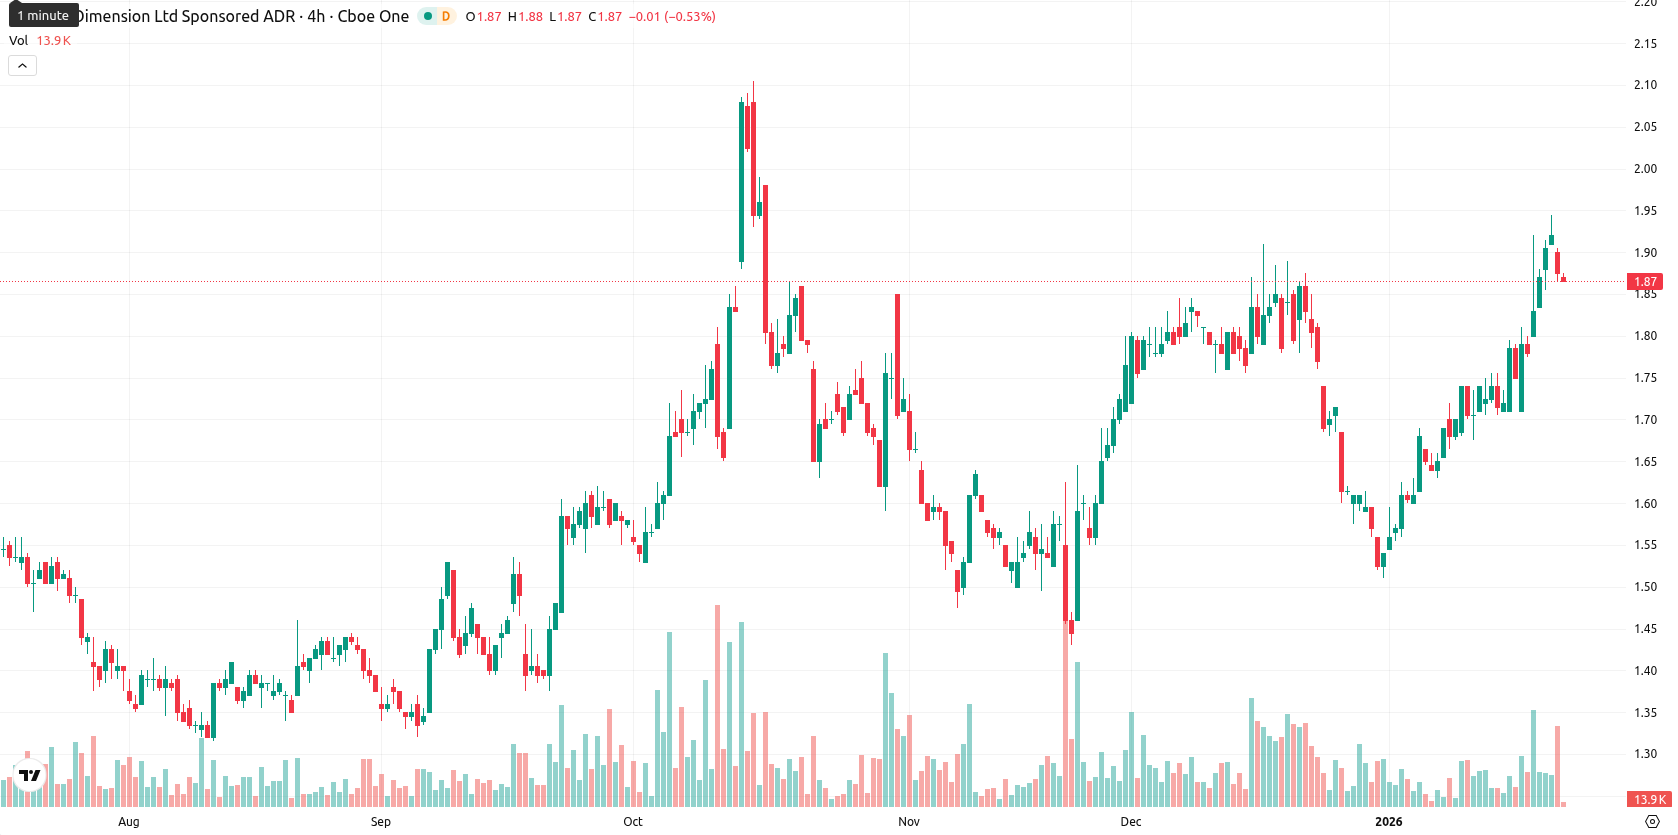
Nano Dimension Ltd (NNDM) is trading at $1.86, which is above the MA-20 ($1.69), MA-50 ($1.70), and MA-200 ($1.57), indicating a persistent bullish bias for the short-, medium-, and long-term trends.
Highlights
- NNDM trades at $1.86, above its MA-20 ($1.69), MA-50 ($1.70), and MA-200 ($1.57), confirming a sustained bullish trend across all timeframes.
- Overbought signals dominate with a daily RSI of 72.29, Stochastic RSI at 100.00, and CCI at 205.73, suggesting elevated reversal risk despite strong momentum.
- Key technical levels are dynamic support at $1.73 and resistance at $2.00, with an 80%+ probability of continued strength or sideways consolidation within this range over the next five days.
Overbought signals as buyers dominate within weak trend structure
The nearest dynamic support on the daily timeframe is the Ichimoku Kijun at $1.73, while immediate resistance aligns with the MA-50 at $1.70 — already surpassed — with the next round level resistance at $2.00. Momentum remains moderately positive with a daily MACD "Buy" and relatively subdued ADX (16.93, neutral), signaling only a weak directional trend. Oscillators highlight overbought conditions: the RSI is high at 72.29, the Stochastic RSI reads a peak 100.00, and the CCI indicates overbought territory at 205.73. Bull/Bear Power is positive on the daily close, suggesting buyers still dominate, while the Awesome Oscillator also supports a continued bullish tone.
Sideways bias as breakout risk depends on momentum shift
For the next five trading days, a typical volatility band is projected at $1.73 – $2.00, keeping current price action within 10% of these bounds. There is a very high probability (more than 80%) of continued price strength and a very low probability of a reversal, according to "Buy" or "Strong Buy" signals from RSI-W1, MACD-W1, and MA-50-W1. The baseline scenario favors sideways consolidation between support at $1.73 and resistance at $2.00. If bullish momentum deepens, an upside break above $2.00 could spur further gains, whereas a drop below $1.73 would likely bring renewed selling pressure.
Previously it was reported that Nano Dimension Ltd is trading in an established bullish structure above key moving averages, with the price supported by robust momentum and strong demand in defense and aerospace driving recent gains. However, overbought technical indicators and elevated volatility suggest a near-term consolidation is likely, with immediate resistance just below $2.00 and dynamic support at $1.72.


Latest Nano Dimension News


-
 Afghanistan
-
 Albania
-
 Algeria
-
 Angola
-
 Argentina
-
 Armenia
-
 Australia
-
 Austria
-
 Azerbaijan
-
 Bahamas
-
 Bahrain
-
 Bangladesh
-
 Belarus
-
 Belgium
-
 Bolivia
-
 Botswana
-
 Brazil
-
 Brunei
-
 Bulgaria
-
 Cambodia
-
 Cameroon
-
 Canada
-
 Chile
Chile
-
 China
China
-
 Colombia
-
 Congo
Congo
-
 Costa Rica
-
 Cote d'Ivoire
-
 Croatia
-
 Cuba
Cuba
-
 Cyprus
-
 Czechia
-
 DR Congo
-
 Denmark
-
 Dominican Republic
-
 Ecuador
-
 Egypt
Egypt
-
 El Salvador
-
 Estonia
-
 Eswatini
-
 Ethiopia
-
 Finland
-
 France
-
 Georgia
-
 Germany
-
 Ghana
Ghana
-
 Greece
-
 Haiti
Haiti
-
 Hong Kong
-
 Hungary
-
 India
India
-
 Indonesia
-
 Iran, Islamic republic
-
 Iraq
Iraq
-
 Ireland
-
 Israel
-
 Italy
Italy
-
 Jamaica
-
 Japan
Japan
-
 Jordan
-
 Kazakhstan
-
 Kenya
Kenya
-
 Korea
Korea
-
 Kuwait
-
 Kyrgyzstan
-
 Laos
Laos
-
 Latvia
-
 Lebanon
-
 Lesotho
-
 Libya
Libya
-
 Lithuania
-
 Luxembourg
-
 Madagascar
-
 Malaysia
-
 Malta
Malta
-
 Mauritius
-
 Mexico
-
 Moldova
-
 Mongolia
-
 Montenegro
-
 Morocco
-
 Mozambique
-
 Myanmar
-
 Namibia
-
 Nepal
Nepal
-
 Netherlands
-
 New Zealand
-
 Nigeria
-
 North Macedonia
-
 Norway
-
 Oman
Oman
-
 Pakistan
-
 Palestine
-
 Panama
-
 Papua New Guinea
-
 Paraguay
-
 Peru
Peru
-
 Philippines
-
 Poland
-
 Portugal
-
 Puerto Rico
-
 Qatar
Qatar
-
 Reunion
-
 Romania
-
 Rwanda
-
 Saudi Arabia
-
 Serbia
-
 Singapore
-
 Slovakia
-
 Slovenia
-
 Somalia
-
 South Africa
-
 Spain
Spain
-
 Sri Lanka
-
 Sweden
-
 Switzerland
-
 Syria
Syria
-
 Taiwan
-
 Tajikistan
-
 Tanzania
-
 Thailand
-
 Trinidad and Tobago
-
 Tunisia
-
 Turkey
-
 UAE
UAE
-
 Uganda
-
 Ukraine
-
 United Kingdom
-
United States
-
 Uruguay
-
 Uzbekistan
-
 Venezuela
-
 Vietnam
-
 Yemen
Yemen
-
 Zambia
-
 Zimbabwe
- Forex
- Crypto
