
Quantum Computing stock price forecast: Downtrend remains likely as QUBT hovers near support

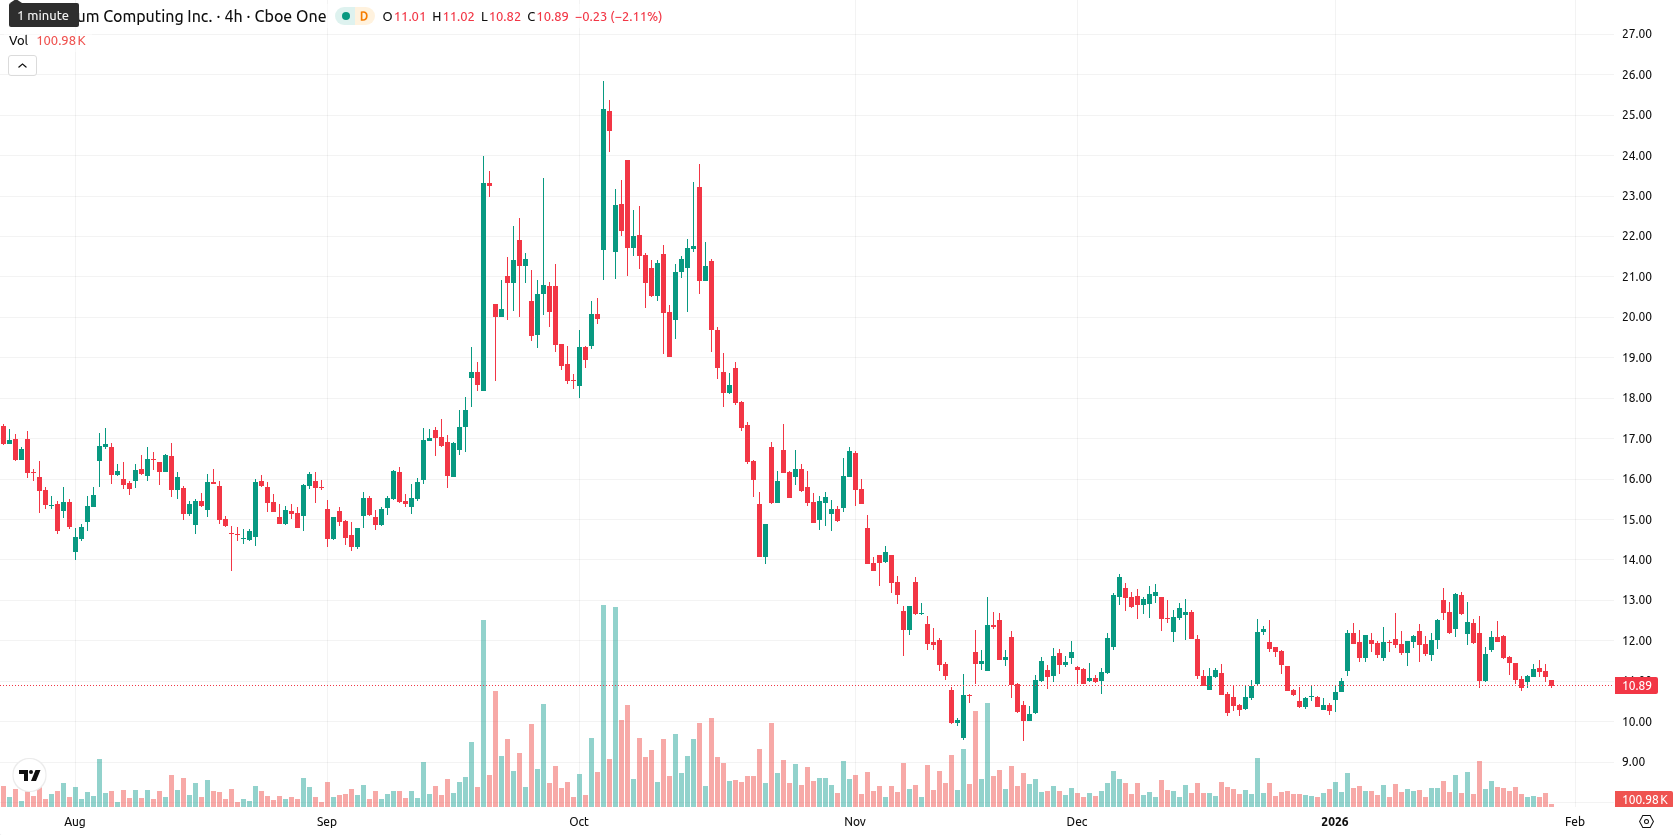
Quantum Computing Inc. (QUBT) is trading at $10.69, which is below the MA-20 at $11.63, the MA-50 at $11.59, and well below the MA-200 at $14.24. This pattern indicates continued pressure from sellers across short-, medium-, and long-term horizons, with Ichimoku Kijun at $11.73 acting as the closest dynamic resistance.
Highlights
- QUBT is trading at $10.69, below the MA-20 ($11.63), MA-50 ($11.59), and MA-200 ($14.24), signaling sustained bearish pressure.
- Momentum indicators including MACD, RSI, Stochastic RSI, and Bull/Bear Power all point to a prevailing sell bias and oversold conditions.
- Short-term price action suggests QUBT will likely trade sideways within a $9.65–$11.75 range over the next five sessions, with a breakout above $11.75 needed for a reversal.
Momentum remains bearish as sellers dominate on weak intraday moves
Momentum signals are decisively bearish, with the MACD and RSI both signaling a sell bias and the ADX indicating a weak, non-directional trend. Both the Stochastic RSI and Bull/Bear Power show oversold conditions and seller dominance intraday, while the Commodity Channel Index also points to a sell signal. The Awesome Oscillator remains neutral, not reinforcing the downtrend. Today’s session opened slightly below the previous close, showing no significant gap, and the price is currently near the lower boundary of today’s range, reflecting low intraday volatility and persistent pressure after the open. This negative intraday dynamic matches the bearish cues from most momentum indicators.
Downside drift likely as probability favors bearish continuation
For the next five trading days, the expected price range for QUBT is between $9.65 and $11.75, aligned with typical volatility and price action. There is a very low probability (less than 20%) of a sustained price increase, making a downward move more likely. In the baseline scenario, QUBT is likely to drift sideways within $9.65 – $11.75. A bullish scenario would require a breakout above $11.75 resistance, while a bearish move could see the price fall toward $9.65 if sellers maintain control.
QUBT continues to trade below its key moving averages, reflecting sustained short- and medium-term bearish momentum with resistance at the Ichimoku Kijun level. Momentum indicators remain mixed, as MACD and ADX are neutral, while RSI and CCI suggest selling pressure, and oversold readings on the Stoch RSI and BBP indicate potential for short-term seller exhaustion.


Latest Quantum Computing News


-
 Afghanistan
-
 Albania
-
 Algeria
-
 Angola
-
 Argentina
-
 Armenia
-
 Australia
-
 Austria
-
 Azerbaijan
-
 Bahamas
-
 Bahrain
-
 Bangladesh
-
 Belarus
-
 Belgium
-
 Bolivia
-
 Botswana
-
 Brazil
-
 Brunei
-
 Bulgaria
-
 Cambodia
-
 Cameroon
-
 Canada
-
 Chile
Chile
-
 China
China
-
 Colombia
-
 Congo
Congo
-
 Costa Rica
-
 Cote d'Ivoire
-
 Croatia
-
 Cuba
Cuba
-
 Cyprus
-
 Czechia
-
 DR Congo
-
 Denmark
-
 Dominican Republic
-
 Ecuador
-
 Egypt
Egypt
-
 El Salvador
-
 Estonia
-
 Eswatini
-
 Ethiopia
-
 Finland
-
 France
-
 Georgia
-
 Germany
-
 Ghana
Ghana
-
 Greece
-
 Haiti
Haiti
-
 Hong Kong
-
 Hungary
-
 India
India
-
 Indonesia
-
 Iran, Islamic republic
-
 Iraq
Iraq
-
 Ireland
-
 Israel
-
 Italy
Italy
-
 Jamaica
-
 Japan
Japan
-
 Jordan
-
 Kazakhstan
-
 Kenya
Kenya
-
 Korea
Korea
-
 Kuwait
-
 Kyrgyzstan
-
 Laos
Laos
-
 Latvia
-
 Lebanon
-
 Lesotho
-
 Libya
Libya
-
 Lithuania
-
 Luxembourg
-
 Madagascar
-
 Malaysia
-
 Malta
Malta
-
 Mauritius
-
 Mexico
-
 Moldova
-
 Mongolia
-
 Montenegro
-
 Morocco
-
 Mozambique
-
 Myanmar
-
 Namibia
-
 Nepal
Nepal
-
 Netherlands
-
 New Zealand
-
 Nigeria
-
 North Macedonia
-
 Norway
-
 Oman
Oman
-
 Pakistan
-
 Palestine
-
 Panama
-
 Papua New Guinea
-
 Paraguay
-
 Peru
Peru
-
 Philippines
-
 Poland
-
 Portugal
-
 Puerto Rico
-
 Qatar
Qatar
-
 Reunion
-
 Romania
-
 Rwanda
-
 Saudi Arabia
-
 Serbia
-
 Singapore
-
 Slovakia
-
 Slovenia
-
 Somalia
-
 South Africa
-
 Spain
Spain
-
 Sri Lanka
-
 Sweden
-
 Switzerland
-
 Syria
Syria
-
 Taiwan
-
 Tajikistan
-
 Tanzania
-
 Thailand
-
 Trinidad and Tobago
-
 Tunisia
-
 Turkey
-
 UAE
UAE
-
 Uganda
-
 Ukraine
-
 United Kingdom
-
United States
-
 Uruguay
-
 Uzbekistan
-
 Venezuela
-
 Vietnam
-
 Yemen
Yemen
-
 Zambia
-
 Zimbabwe
- Forex
- Crypto
