
-5.76% for NuCana stock — oversold levels signal persistent bearish pressure

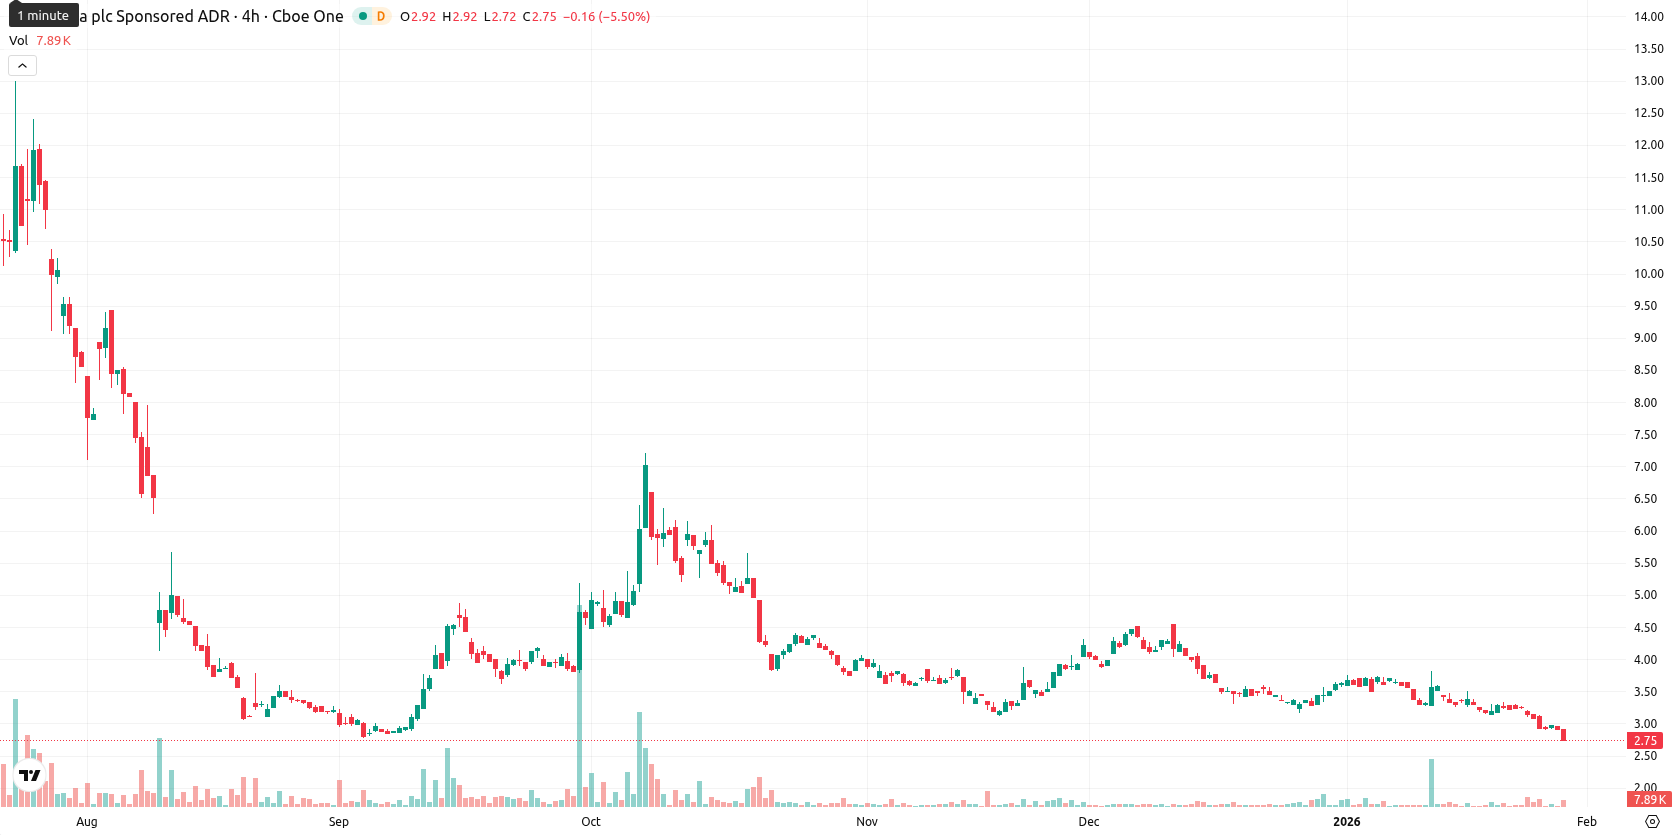
NuCana plc ADR (NCNA) is currently trading at $2.78 after a daily drop of 5.76%, positioning the asset well below its MA-20 at $3.38, MA-50 at $3.59, and MA-200 at $18.58. With NCNA also sitting beneath the Ichimoku Kijun at $3.35, the persistent selling pressure is evident across short, medium, and long-term timeframes.
Highlights
- NCNA trades at $2.78, sharply below its MA-20 ($3.38), MA-50 ($3.59), and MA-200 ($18.58), reflecting sustained selling pressure across all timeframes.
- Momentum indicators (MACD, ADX) confirm pronounced weakness, with oversold readings on RSI, Stochastic RSI, and CCI, while sellers dominate intraday price action following a 5.76% daily decline.
- Technical outlook projects NCNA fluctuating between $2.65 and $2.90 over five sessions, with sub-$2.70 breakdown risking further losses amid the absence of long-term support.
Bearish momentum builds as oversold indicators and volatility intensify
Momentum indicators such as MACD and ADX confirm continued weakness for NCNA, with MACD showing a clear sell signal and ADX reflecting a lack of strength in prevailing trends on the daily chart. Both the RSI and Stochastic RSI are in oversold territory, further validated by a deep oversold reading on the Commodity Channel Index. Negative Bull/Bear Power highlights intraday seller dominance, echoing the current session's decline, as NCNA trades near today’s low at the bottom of an intraday range of $2.72 – $2.93. A slight downward gap at the open and high intraday volatility underscore intensified pressure following the market open, while a lack of long-term support is evident below current levels.
Low upside probability as sideways trend persists amid technical weakness
Over the next five trading days, NCNA is likely to remain within a volatility band of $2.65 – $2.90, consistent with recent price swings. The probability of an upside move remains low, below 20%, while persistent bearish technical signals suggest that further declines are more likely. The baseline scenario expects sideways trading below $2.90; a break above $2.90 could open room toward the $3.00 – $3.10 zone, but a move below $2.70 risks new lows due to the lack of strong technical support.
Previously it was reported that NuCana plc ADR (NCNA) is trading sharply below all key moving averages, with the current price underscoring persistent downside momentum and a lack of nearby support. Bearish momentum signals from indicators such as RSI, MACD, and ADX confirm a strong sell-side bias, while immediate resistance remains overhead and oversold readings suggest sellers are in clear control.


Latest NuCana News


-
 Afghanistan
-
 Albania
-
 Algeria
-
 Angola
-
 Argentina
-
 Armenia
-
 Australia
-
 Austria
-
 Azerbaijan
-
 Bahamas
-
 Bahrain
-
 Bangladesh
-
 Belarus
-
 Belgium
-
 Bolivia
-
 Botswana
-
 Brazil
-
 Brunei
-
 Bulgaria
-
 Cambodia
-
 Cameroon
-
 Canada
-
 Chile
Chile
-
 China
China
-
 Colombia
-
 Congo
Congo
-
 Costa Rica
-
 Cote d'Ivoire
-
 Croatia
-
 Cuba
Cuba
-
 Cyprus
-
 Czechia
-
 DR Congo
-
 Denmark
-
 Dominican Republic
-
 Ecuador
-
 Egypt
Egypt
-
 El Salvador
-
 Estonia
-
 Eswatini
-
 Ethiopia
-
 Finland
-
 France
-
 Georgia
-
 Germany
-
 Ghana
Ghana
-
 Greece
-
 Haiti
Haiti
-
 Hong Kong
-
 Hungary
-
 India
India
-
 Indonesia
-
 Iran, Islamic republic
-
 Iraq
Iraq
-
 Ireland
-
 Israel
-
 Italy
Italy
-
 Jamaica
-
 Japan
Japan
-
 Jordan
-
 Kazakhstan
-
 Kenya
Kenya
-
 Korea
Korea
-
 Kuwait
-
 Kyrgyzstan
-
 Laos
Laos
-
 Latvia
-
 Lebanon
-
 Lesotho
-
 Libya
Libya
-
 Lithuania
-
 Luxembourg
-
 Madagascar
-
 Malaysia
-
 Malta
Malta
-
 Mauritius
-
 Mexico
-
 Moldova
-
 Mongolia
-
 Montenegro
-
 Morocco
-
 Mozambique
-
 Myanmar
-
 Namibia
-
 Nepal
Nepal
-
 Netherlands
-
 New Zealand
-
 Nigeria
-
 North Macedonia
-
 Norway
-
 Oman
Oman
-
 Pakistan
-
 Palestine
-
 Panama
-
 Papua New Guinea
-
 Paraguay
-
 Peru
Peru
-
 Philippines
-
 Poland
-
 Portugal
-
 Puerto Rico
-
 Qatar
Qatar
-
 Reunion
-
 Romania
-
 Rwanda
-
 Saudi Arabia
-
 Serbia
-
 Singapore
-
 Slovakia
-
 Slovenia
-
 Somalia
-
 South Africa
-
 Spain
Spain
-
 Sri Lanka
-
 Sweden
-
 Switzerland
-
 Syria
Syria
-
 Taiwan
-
 Tajikistan
-
 Tanzania
-
 Thailand
-
 Trinidad and Tobago
-
 Tunisia
-
 Turkey
-
 UAE
UAE
-
 Uganda
-
 Ukraine
-
 United Kingdom
-
United States
-
 Uruguay
-
 Uzbekistan
-
 Venezuela
-
 Vietnam
-
 Yemen
Yemen
-
 Zambia
-
 Zimbabwe
- Forex
- Crypto
