
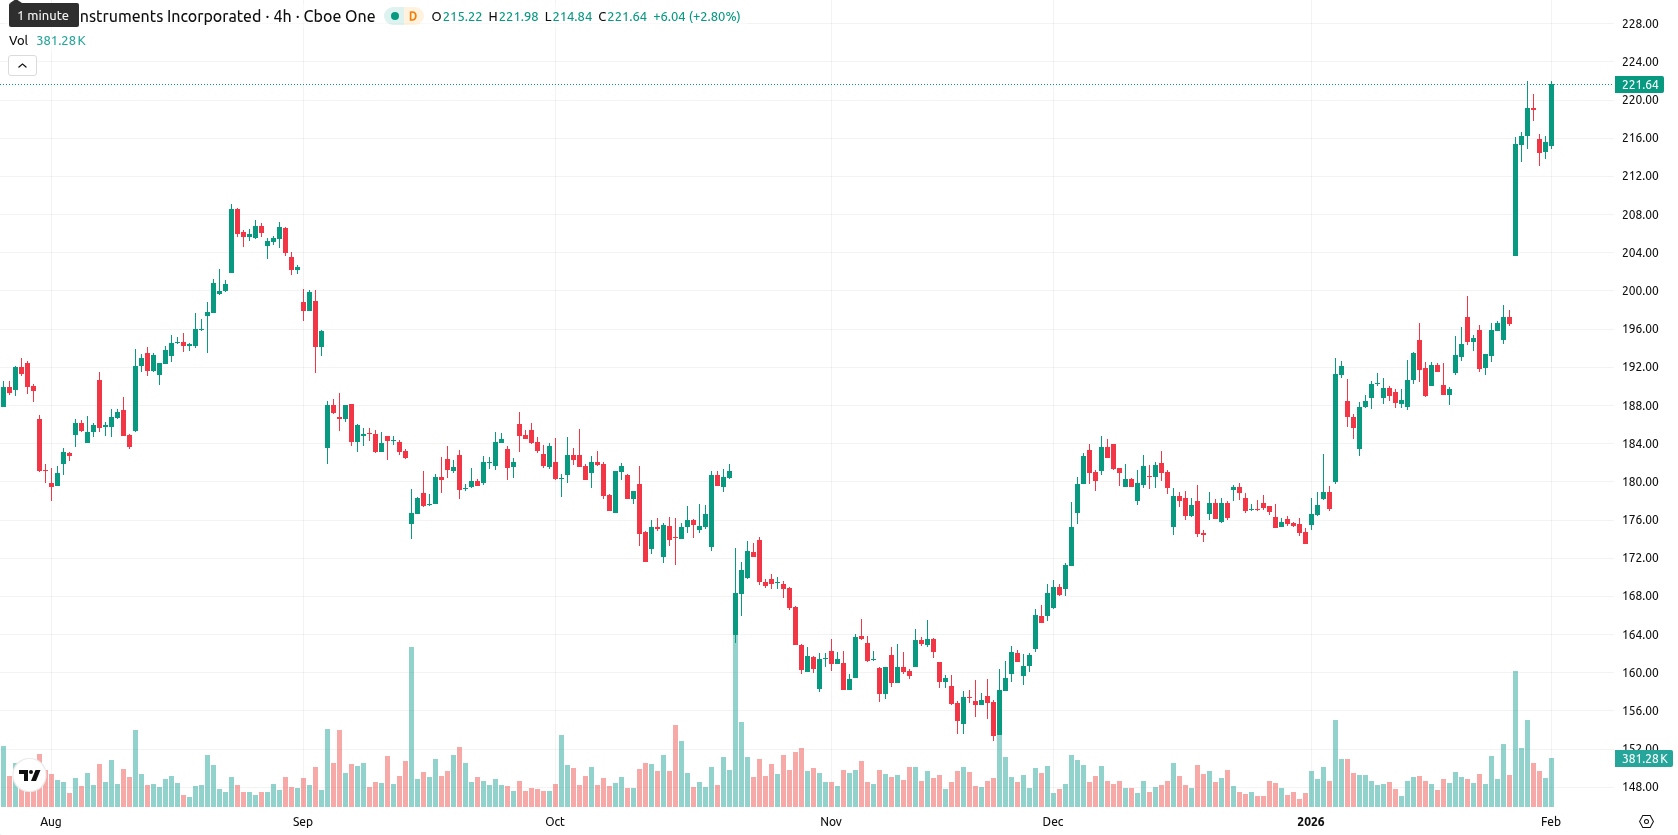
Texas Instruments stock gains 3.11% as bullish momentum builds despite overbought signals

Texas Instruments Incorporated (TXN) is trading at $222.32, clearly above the MA-20 ($193.97), MA-50 ($181.44), and MA-200 ($183.81). This confirms bullish momentum across short-, medium-, and long-term trends, with dynamic support levels seen at the Ichimoku Kijun ($197.72), while the MA-50 beneath price may now act as an additional support.
Highlights
- Donaldson Capital Management LLC increased its stake in Texas Instruments by 1.6% during Q3, now holding 337,569 shares, per SEC filing.
- Texas Instruments (TXN) is trading at $222.32, well above MA-20 ($193.97), MA-50 ($181.44), and MA-200 ($183.81), confirming strong bullish momentum.
- Short-term technicals show overbought conditions with RSI near 74 and Stochastic RSI showing a sell, yet high probability (80%+) supports further upside with $215.00–$230.00 range.
Institutional accumulation as Donaldson lifts Texas Instruments holdings
Donaldson Capital Management LLC increased its holdings in Texas Instruments by 1.6% during the third quarter, as disclosed in a recent SEC filing. The institutional investor now owns 337,569 shares of the company.
Sustained gains and overbought risk as indicators flash mixed signals
Momentum indicators such as the MACD and ADX point to strengthening bullish momentum, with the MACD generating a buy signal and the ADX reflecting a firm trend. However, the RSI and Commodity Channel Index both register overbought readings near 74 and 197, and the Stochastic RSI indicates a strong sell, highlighting short-term overbought conditions. Bull/Bear Power shows buyer dominance and strong upward intraday pressure, with the Awesome Oscillator supporting the bullish move. Today, TXN opened nearly flat compared to the previous close, and the current price sits near the intraday high of $221.98, marking robust performance and high volatility for the session. Strength has persisted after the open, but conflicting overbought oscillator signals warn that further upward movement may be stretched in the immediate term.
High odds of consolidation as buy triggers outnumber downside risk
For the next five trading days, the expected normalized range is $215.00 to $230.00, reflecting typical volatility for a blue-chip stock like TXN. The probability of a further price increase is very high (more than 80%), while the likelihood of a decrease is much less given the number of buy signals across weekly trend indicators. The baseline scenario envisions consolidation between support and resistance as the stock digests recent gains. A bullish scenario would see TXN break above $230.00 and extend the rally. Conversely, a bearish scenario unfolds if the price falls below $215.00, with a pullback toward intermediate support levels.
Previously it was reported that Texas Instruments is exhibiting strong bullish momentum, trading well above its key moving averages and supported by robust sector demand and upbeat earnings guidance. Momentum indicators including MACD, ADX, and RSI confirm sustained buying strength, though the stock is approaching overbought territory with support seen near the $186 level and resistance expected as volatility rises.


Latest Texas Instruments News


-
 Afghanistan
-
 Albania
-
 Algeria
-
 Angola
-
 Argentina
-
 Armenia
-
 Australia
-
 Austria
-
 Azerbaijan
-
 Bahamas
-
 Bahrain
-
 Bangladesh
-
 Belarus
-
 Belgium
-
 Bolivia
-
 Botswana
-
 Brazil
-
 Brunei
-
 Bulgaria
-
 Cambodia
-
 Cameroon
-
 Canada
-
 Chile
Chile
-
 China
China
-
 Colombia
-
 Congo
Congo
-
 Costa Rica
-
 Cote d'Ivoire
-
 Croatia
-
 Cuba
Cuba
-
 Cyprus
-
 Czechia
-
 DR Congo
-
 Denmark
-
 Dominican Republic
-
 Ecuador
-
 Egypt
Egypt
-
 El Salvador
-
 Estonia
-
 Eswatini
-
 Ethiopia
-
 Finland
-
 France
-
 Georgia
-
 Germany
-
 Ghana
Ghana
-
 Greece
-
 Haiti
Haiti
-
 Hong Kong
-
 Hungary
-
 India
India
-
 Indonesia
-
 Iran, Islamic republic
-
 Iraq
Iraq
-
 Ireland
-
 Israel
-
 Italy
Italy
-
 Jamaica
-
 Japan
Japan
-
 Jordan
-
 Kazakhstan
-
 Kenya
Kenya
-
 Korea
Korea
-
 Kuwait
-
 Kyrgyzstan
-
 Laos
Laos
-
 Latvia
-
 Lebanon
-
 Lesotho
-
 Libya
Libya
-
 Lithuania
-
 Luxembourg
-
 Madagascar
-
 Malaysia
-
 Malta
Malta
-
 Mauritius
-
 Mexico
-
 Moldova
-
 Mongolia
-
 Montenegro
-
 Morocco
-
 Mozambique
-
 Myanmar
-
 Namibia
-
 Nepal
Nepal
-
 Netherlands
-
 New Zealand
-
 Nigeria
-
 North Macedonia
-
 Norway
-
 Oman
Oman
-
 Pakistan
-
 Palestine
-
 Panama
-
 Papua New Guinea
-
 Paraguay
-
 Peru
Peru
-
 Philippines
-
 Poland
-
 Portugal
-
 Puerto Rico
-
 Qatar
Qatar
-
 Reunion
-
 Romania
-
 Rwanda
-
 Saudi Arabia
-
 Serbia
-
 Singapore
-
 Slovakia
-
 Slovenia
-
 Somalia
-
 South Africa
-
 Spain
Spain
-
 Sri Lanka
-
 Sweden
-
 Switzerland
-
 Syria
Syria
-
 Taiwan
-
 Tajikistan
-
 Tanzania
-
 Thailand
-
 Trinidad and Tobago
-
 Tunisia
-
 Turkey
-
 UAE
UAE
-
 Uganda
-
 Ukraine
-
 United Kingdom
-
United States
-
 Uruguay
-
 Uzbekistan
-
 Venezuela
-
 Vietnam
-
 Yemen
Yemen
-
 Zambia
-
 Zimbabwe
- Forex
- Crypto
