
Hut 8 stock rises 3.02% as momentum indicators remain uncertain and price tests resistance

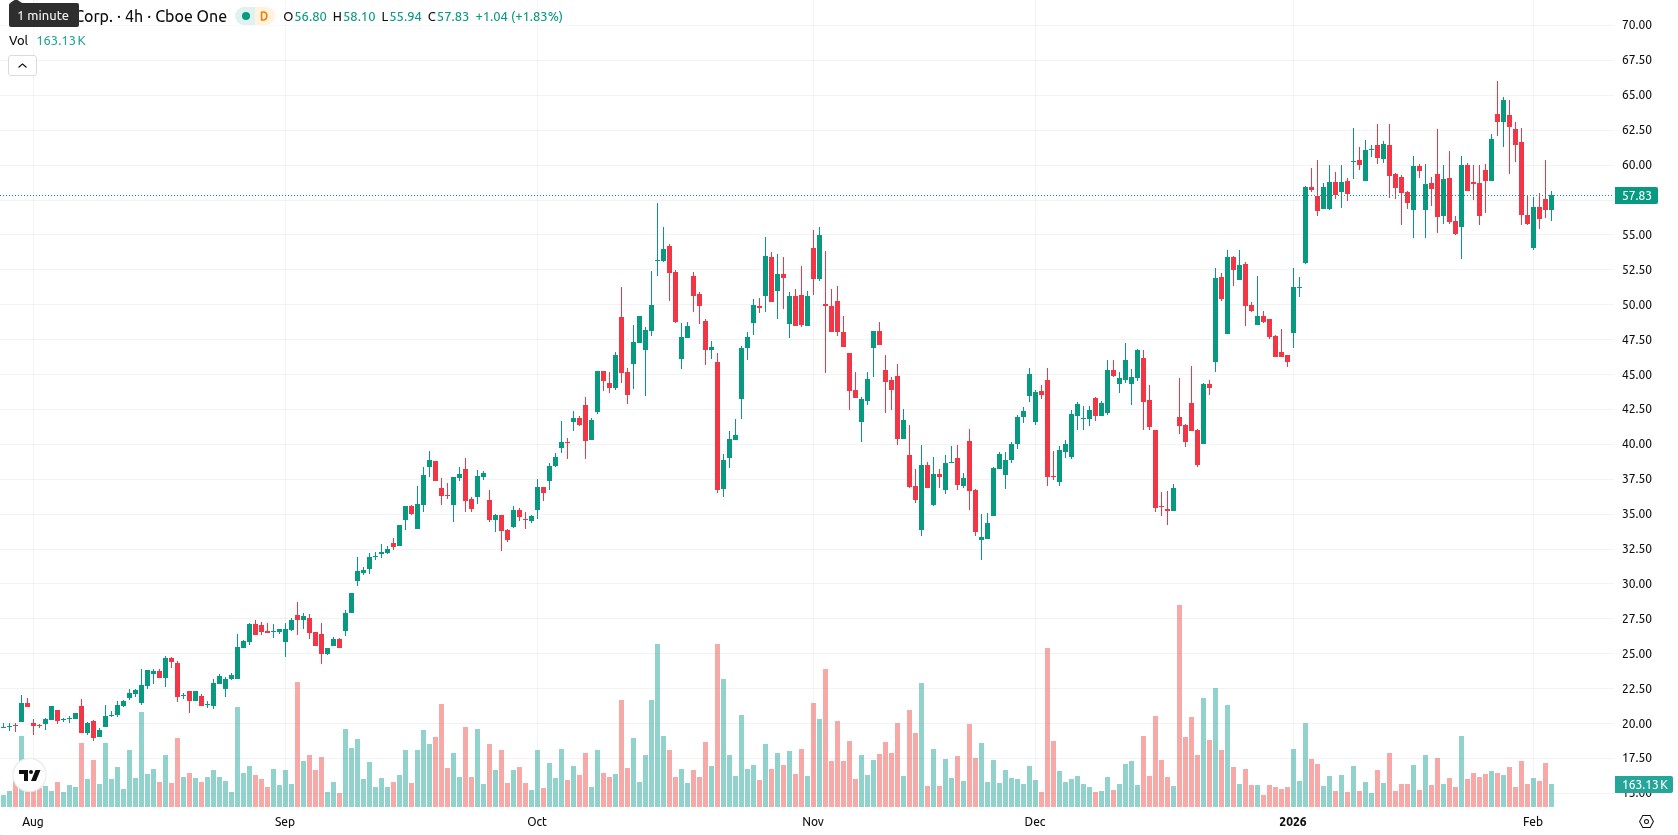
Hut 8 Corp (HUT) is trading at $57.88 after a daily gain of $1.70 (3.02%). The price sits just below the MA-20 ($58.86), facing some short-term resistance, while remaining comfortably above the MA-50 ($49.41) and MA-200 ($32.34), underlining a medium- and long-term bullish trend.
Highlights
- Hut 8 trades at $57.88, just below the MA-20 ($58.86), facing short-term resistance but above medium- and long-term bullish supports at MA-50 ($49.41) and MA-200 ($32.34).
- Momentum signals are mixed: daily MACD signals Strong Buy, but ADX at 18.61 and oversold Stochastic RSI/CCI indicate weak trend strength and recent selling pressure.
- In the next five sessions, Hut 8 is likely to consolidate sideways in the $54.00–$62.00 range, with a high (>80%) probability of a price increase if resistance at $60–$62 breaks.
Mixed momentum as support holds and sellers pressure intraday
Technically, the nearest dynamic support is set by the Ichimoku Kijun line at $55.78, and with price action above this level, MA-50 and the round number region around $60 offer the next clear resistance. Momentum signals are currently mixed: the daily MACD indicates a strong buy, yet ADX at 18.61 shows the trend is not convincing in strength. Both Stochastic RSI and Bull/Bear Power oscillate in oversold territory, joined by an oversold CCI, which points to recent selling pressure despite a neutral RSI at 50.71. The negative Bull/Bear Power reading highlights intraday seller control as the price fluctuates within today's $55.97 – $60.07 range amid moderate volatility.
Consolidation likely as upside probability outweighs downside risk
In the short term, the typical volatility band is $54.00 to $62.00 over the next five sessions. The probability of upside movement remains high, above 80%, while downside risk is limited. Price action is most likely to consolidate between $54.00 and $62.00, digesting recent gains. Should HUT break out above the $60 – $62 resistance region, further upward momentum is possible, whereas a drop below $55.78 could initiate a retest of support near $54.00, with longer-term bullish structure still intact.
Previously it was reported that Hut 8 Corp. is trading above key moving averages, maintaining a bullish medium- and long-term structure, though currently facing near-term seller pressure just below its short-term moving average. Mixed momentum readings—with strong MACD buy signals contrasted by neutral ADX and overbought oscillators—suggest possible short-term consolidation or volatility, but dynamic support is holding and a move higher remains favored if momentum persists.


Latest Hut 8 News


-
 Afghanistan
-
 Albania
-
 Algeria
-
 Angola
-
 Argentina
-
 Armenia
-
 Australia
-
 Austria
-
 Azerbaijan
-
 Bahamas
-
 Bahrain
-
 Bangladesh
-
 Belarus
-
 Belgium
-
 Bolivia
-
 Botswana
-
 Brazil
-
 Brunei
-
 Bulgaria
-
 Cambodia
-
 Cameroon
-
 Canada
-
 Chile
Chile
-
 China
China
-
 Colombia
-
 Congo
Congo
-
 Costa Rica
-
 Cote d'Ivoire
-
 Croatia
-
 Cuba
Cuba
-
 Cyprus
-
 Czechia
-
 DR Congo
-
 Denmark
-
 Dominican Republic
-
 Ecuador
-
 Egypt
Egypt
-
 El Salvador
-
 Estonia
-
 Eswatini
-
 Ethiopia
-
 Finland
-
 France
-
 Georgia
-
 Germany
-
 Ghana
Ghana
-
 Greece
-
 Haiti
Haiti
-
 Hong Kong
-
 Hungary
-
 India
India
-
 Indonesia
-
 Iran, Islamic republic
-
 Iraq
Iraq
-
 Ireland
-
 Israel
-
 Italy
Italy
-
 Jamaica
-
 Japan
Japan
-
 Jordan
-
 Kazakhstan
-
 Kenya
Kenya
-
 Korea
Korea
-
 Kuwait
-
 Kyrgyzstan
-
 Laos
Laos
-
 Latvia
-
 Lebanon
-
 Lesotho
-
 Libya
Libya
-
 Lithuania
-
 Luxembourg
-
 Madagascar
-
 Malaysia
-
 Malta
Malta
-
 Mauritius
-
 Mexico
-
 Moldova
-
 Mongolia
-
 Montenegro
-
 Morocco
-
 Mozambique
-
 Myanmar
-
 Namibia
-
 Nepal
Nepal
-
 Netherlands
-
 New Zealand
-
 Nigeria
-
 North Macedonia
-
 Norway
-
 Oman
Oman
-
 Pakistan
-
 Palestine
-
 Panama
-
 Papua New Guinea
-
 Paraguay
-
 Peru
Peru
-
 Philippines
-
 Poland
-
 Portugal
-
 Puerto Rico
-
 Qatar
Qatar
-
 Reunion
-
 Romania
-
 Rwanda
-
 Saudi Arabia
-
 Serbia
-
 Singapore
-
 Slovakia
-
 Slovenia
-
 Somalia
-
 South Africa
-
 Spain
Spain
-
 Sri Lanka
-
 Sweden
-
 Switzerland
-
 Syria
Syria
-
 Taiwan
-
 Tajikistan
-
 Tanzania
-
 Thailand
-
 Trinidad and Tobago
-
 Tunisia
-
 Turkey
-
 UAE
UAE
-
 Uganda
-
 Ukraine
-
 United Kingdom
-
United States
-
 Uruguay
-
 Uzbekistan
-
 Venezuela
-
 Vietnam
-
 Yemen
Yemen
-
 Zambia
-
 Zimbabwe
- Forex
- Crypto
