
Nano Dimension stock price forecast: Bullish outlook as NNDM slips toward $1.88

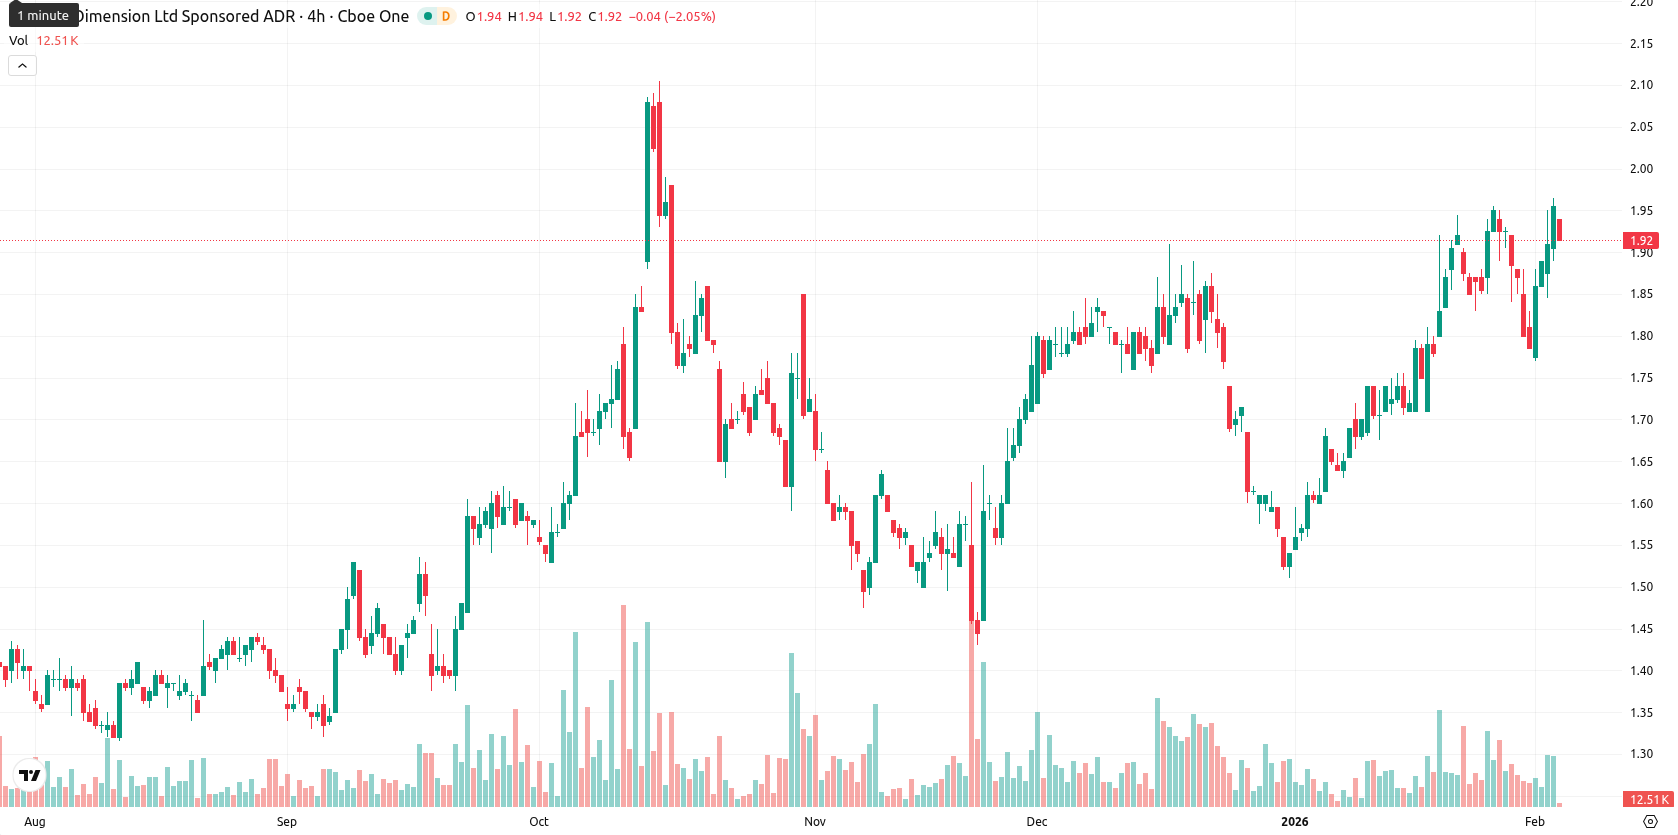
Nano Dimension Ltd. (NNDM) is trading at $1.88, standing above the MA-20 ($1.80), MA-50 ($1.75), and MA-200 ($1.59), confirming a bullish alignment for short-, medium-, and long-term trends.
Highlights
- NNDM trades at $1.88, positioned above the MA-20 ($1.80), MA-50 ($1.75), and MA-200 ($1.59), confirming bullish alignment across all trend horizons.
- Momentum indicators (MACD, ADX, RSI 62, CCI, Bull/Bear Power) collectively signal mild bullish sentiment, with buyers remaining in control but without excessive upside.
- Expected short-term price range is $1.80–$2.00 for the next five days, with a probability above 80% for further gains and downside risk below 20%.
Mild consolidation seen after gap down and buyer dominance
The nearest dynamic support is around the Ichimoku Kijun level at $1.74, while short-term resistance is likely at the MA-50, now below price, with the next focus on round levels near $2.00. Momentum is moderately positive on the daily timeframe, with MACD and ADX showing continued upward structure but with only moderate strength. RSI indicates mild bullish momentum at 62 (not overbought), CCI is also bullish but not extreme, and Stochastic RSI gives a neutral reading, highlighting no strong overbought or oversold conditions; however, the Bull/Bear Power points to active buyer dominance intraday. The Awesome Oscillator trend supports the overall bullish scenario. The price opened with a minor gap down from $1.95 to $1.88, matching the session low and highlighting pressure after the open, with low intraday volatility and the price sitting at the lower end of today's range. Some divergence exists among oscillators, but overall, the intraday tone aligns with mild consolidation after initial downward pressure.
Sideways bias with breakout risk as upside probability increases
For the next five trading days, the expected price range is $1.80 to $2.00. The probability of an increase is more likely, with an upmove chance very high (more than 80%), while the downside risk is very low (less than 20%). The baseline scenario is that NNDM moves sideways within the corridor of $1.80–$2.00. A bullish breakout above $2.00 would signal further upward momentum, while a bearish breakdown below $1.80 could trigger a deeper retracement toward major supports.
Previously it was reported that Nano Dimension Ltd. is maintaining strong bullish momentum, with the price trading notably above all major moving averages and the Ichimoku Kijun offering dynamic support. Momentum indicators including MACD, ADX, and RSI remain positive as resistance near $2.00 is tested, reinforcing the near-term bullish outlook while key support holds and volatility persists.


Latest Nano Dimension News


-
 Afghanistan
-
 Albania
-
 Algeria
-
 Angola
-
 Argentina
-
 Armenia
-
 Australia
-
 Austria
-
 Azerbaijan
-
 Bahamas
-
 Bahrain
-
 Bangladesh
-
 Belarus
-
 Belgium
-
 Bolivia
-
 Botswana
-
 Brazil
-
 Brunei
-
 Bulgaria
-
 Cambodia
-
 Cameroon
-
 Canada
-
 Chile
Chile
-
 China
China
-
 Colombia
-
 Congo
Congo
-
 Costa Rica
-
 Cote d'Ivoire
-
 Croatia
-
 Cuba
Cuba
-
 Cyprus
-
 Czechia
-
 DR Congo
-
 Denmark
-
 Dominican Republic
-
 Ecuador
-
 Egypt
Egypt
-
 El Salvador
-
 Estonia
-
 Eswatini
-
 Ethiopia
-
 Finland
-
 France
-
 Georgia
-
 Germany
-
 Ghana
Ghana
-
 Greece
-
 Haiti
Haiti
-
 Hong Kong
-
 Hungary
-
 India
India
-
 Indonesia
-
 Iran, Islamic republic
-
 Iraq
Iraq
-
 Ireland
-
 Israel
-
 Italy
Italy
-
 Jamaica
-
 Japan
Japan
-
 Jordan
-
 Kazakhstan
-
 Kenya
Kenya
-
 Korea
Korea
-
 Kuwait
-
 Kyrgyzstan
-
 Laos
Laos
-
 Latvia
-
 Lebanon
-
 Lesotho
-
 Libya
Libya
-
 Lithuania
-
 Luxembourg
-
 Madagascar
-
 Malaysia
-
 Malta
Malta
-
 Mauritius
-
 Mexico
-
 Moldova
-
 Mongolia
-
 Montenegro
-
 Morocco
-
 Mozambique
-
 Myanmar
-
 Namibia
-
 Nepal
Nepal
-
 Netherlands
-
 New Zealand
-
 Nigeria
-
 North Macedonia
-
 Norway
-
 Oman
Oman
-
 Pakistan
-
 Palestine
-
 Panama
-
 Papua New Guinea
-
 Paraguay
-
 Peru
Peru
-
 Philippines
-
 Poland
-
 Portugal
-
 Puerto Rico
-
 Qatar
Qatar
-
 Reunion
-
 Romania
-
 Rwanda
-
 Saudi Arabia
-
 Serbia
-
 Singapore
-
 Slovakia
-
 Slovenia
-
 Somalia
-
 South Africa
-
 Spain
Spain
-
 Sri Lanka
-
 Sweden
-
 Switzerland
-
 Syria
Syria
-
 Taiwan
-
 Tajikistan
-
 Tanzania
-
 Thailand
-
 Trinidad and Tobago
-
 Tunisia
-
 Turkey
-
 UAE
UAE
-
 Uganda
-
 Ukraine
-
 United Kingdom
-
United States
-
 Uruguay
-
 Uzbekistan
-
 Venezuela
-
 Vietnam
-
 Yemen
Yemen
-
 Zambia
-
 Zimbabwe
- Forex
- Crypto
