
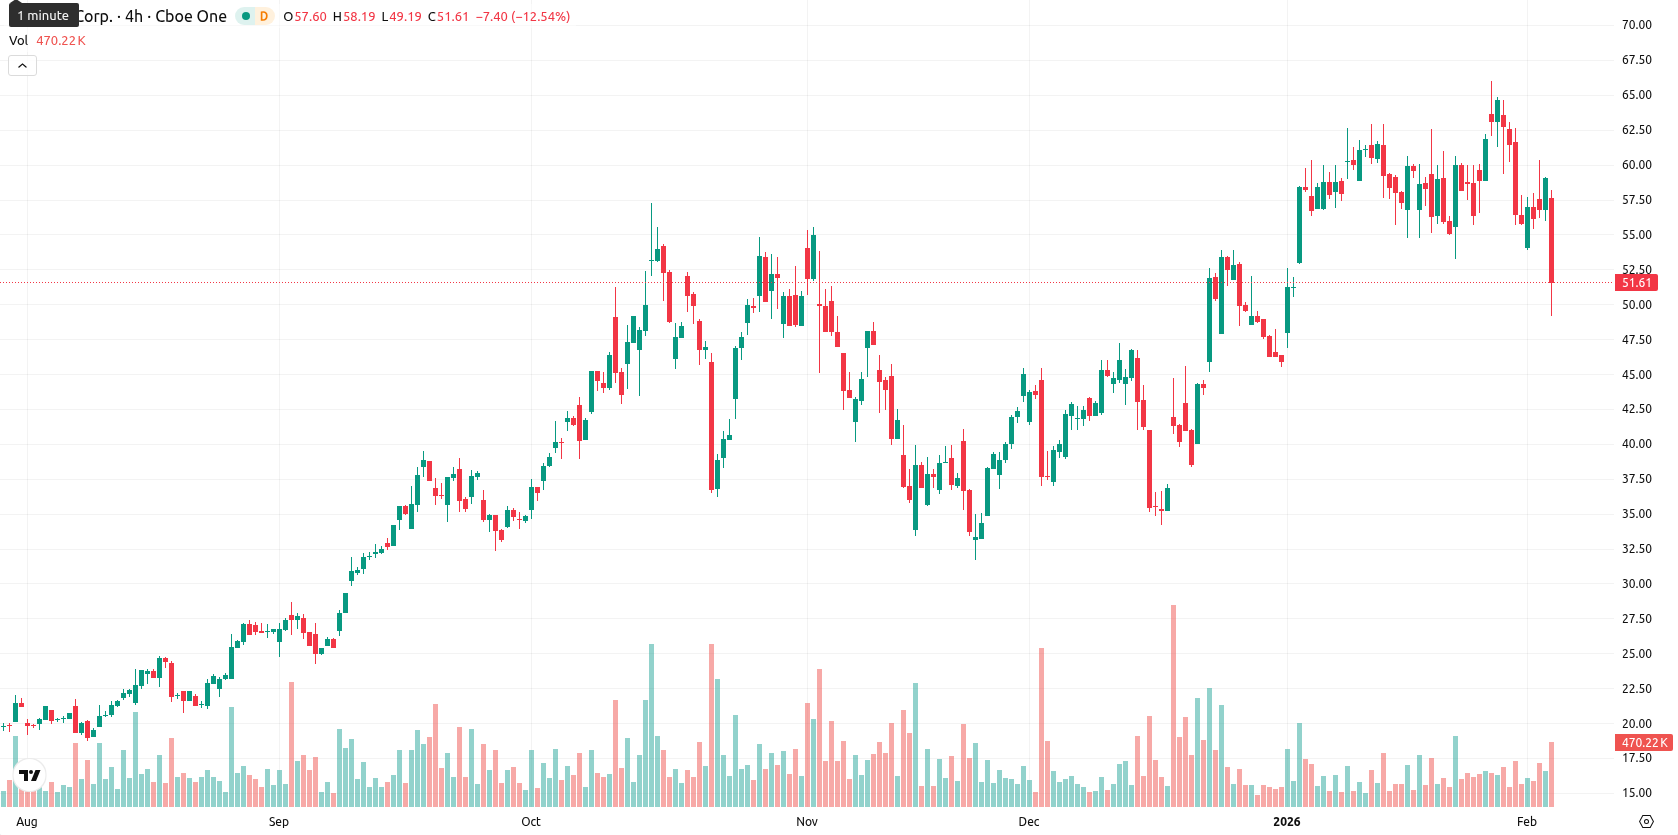
-13.03% for Hut 8 stock — dynamic resistance at $55.78 with sellers in control

Hut 8 Corp (HUT) is trading at $51.33, down 13.03% for the day. The price is currently below its MA-20 ($58.90) but remains above the MA-50 ($49.84) and MA-200 ($32.58), indicating short-term weakness but medium- and long-term bullish structure.
Highlights
- HUT trades at $51.33, below its MA-20 ($58.90) but above MA-50 ($49.84) and MA-200 ($32.58), indicating short-term weakness with medium/long-term bullish bias.
- Daily momentum indicators are mixed: MACD shows bullish potential, but ADX is weak (18.31), and intraday seller dominance drives high volatility and a 13.03% drop.
- Sideways consolidation between $49.00 and $55.00 is the baseline, with over 80% probability of an upward move; key levels are $49.84 (support) and $55.78 (resistance).
Bullish momentum challenged by weak trend and resistance at Kijun
Technically, HUT faces immediate dynamic resistance at the Ichimoku Kijun ($55.78) and finds local support at the MA-50 ($49.84). The daily MACD signals strong bullish potential; however, weak ADX at 18.31 reflects the absence of a defined trend. Daily RSI stands at 54.61 and Stochastic RSI at 30.05, implying modest buying interest, with daily CCI in neutral territory. Bull/Bear Power is overbought on the daily timeframe but shows strong intraday seller dominance, and the Awesome Oscillator remains neutral, while volatility persists along the $49.44 – $57.94 range with persistent bearish pressure.
Sideways consolidation with rebound potential as technicals stay bullish
For the next five trading days, HUT is likely to trade in a typical volatility band of $49.00 to $55.00. There is a high probability (over 80%) of an upward rebound, with technical indicators on the weekly chart—Moving Averages, RSI, ADX, and MACD—showing consistent buy signals. The base case anticipates sideways consolidation in this range. A bullish close above $55.78 (Ichimoku Kijun) would open the path to higher resistance, while a breakdown below the MA-50 ($49.84) could accelerate downside toward $47.00 – $48.00.
Previously it was reported that Hut 8 Corp. is trading below its 20-day moving average but remains above both the 50- and 200-day averages, reflecting short-term weakness within a sustained broader uptrend. Momentum signals are mixed, with a strong MACD offset by neutral-to-weak readings in ADX and CCI and an RSI holding above 50, as the asset faces high intraday volatility amid active sellers.


Latest Hut 8 News


-
 Afghanistan
-
 Albania
-
 Algeria
-
 Angola
-
 Argentina
-
 Armenia
-
 Australia
-
 Austria
-
 Azerbaijan
-
 Bahamas
-
 Bahrain
-
 Bangladesh
-
 Belarus
-
 Belgium
-
 Bolivia
-
 Botswana
-
 Brazil
-
 Brunei
-
 Bulgaria
-
 Cambodia
-
 Cameroon
-
 Canada
-
 Chile
Chile
-
 China
China
-
 Colombia
-
 Congo
Congo
-
 Costa Rica
-
 Cote d'Ivoire
-
 Croatia
-
 Cuba
Cuba
-
 Cyprus
-
 Czechia
-
 DR Congo
-
 Denmark
-
 Dominican Republic
-
 Ecuador
-
 Egypt
Egypt
-
 El Salvador
-
 Estonia
-
 Eswatini
-
 Ethiopia
-
 Finland
-
 France
-
 Georgia
-
 Germany
-
 Ghana
Ghana
-
 Greece
-
 Haiti
Haiti
-
 Hong Kong
-
 Hungary
-
 India
India
-
 Indonesia
-
 Iran, Islamic republic
-
 Iraq
Iraq
-
 Ireland
-
 Israel
-
 Italy
Italy
-
 Jamaica
-
 Japan
Japan
-
 Jordan
-
 Kazakhstan
-
 Kenya
Kenya
-
 Korea
Korea
-
 Kuwait
-
 Kyrgyzstan
-
 Laos
Laos
-
 Latvia
-
 Lebanon
-
 Lesotho
-
 Libya
Libya
-
 Lithuania
-
 Luxembourg
-
 Madagascar
-
 Malaysia
-
 Malta
Malta
-
 Mauritius
-
 Mexico
-
 Moldova
-
 Mongolia
-
 Montenegro
-
 Morocco
-
 Mozambique
-
 Myanmar
-
 Namibia
-
 Nepal
Nepal
-
 Netherlands
-
 New Zealand
-
 Nigeria
-
 North Macedonia
-
 Norway
-
 Oman
Oman
-
 Pakistan
-
 Palestine
-
 Panama
-
 Papua New Guinea
-
 Paraguay
-
 Peru
Peru
-
 Philippines
-
 Poland
-
 Portugal
-
 Puerto Rico
-
 Qatar
Qatar
-
 Reunion
-
 Romania
-
 Rwanda
-
 Saudi Arabia
-
 Serbia
-
 Singapore
-
 Slovakia
-
 Slovenia
-
 Somalia
-
 South Africa
-
 Spain
Spain
-
 Sri Lanka
-
 Sweden
-
 Switzerland
-
 Syria
Syria
-
 Taiwan
-
 Tajikistan
-
 Tanzania
-
 Thailand
-
 Trinidad and Tobago
-
 Tunisia
-
 Turkey
-
 UAE
UAE
-
 Uganda
-
 Ukraine
-
 United Kingdom
-
United States
-
 Uruguay
-
 Uzbekistan
-
 Venezuela
-
 Vietnam
-
 Yemen
Yemen
-
 Zambia
-
 Zimbabwe
- Forex
- Crypto
