
Quantum Computing stock price forecast: Weakness continues as QUBT slips below key moving averages

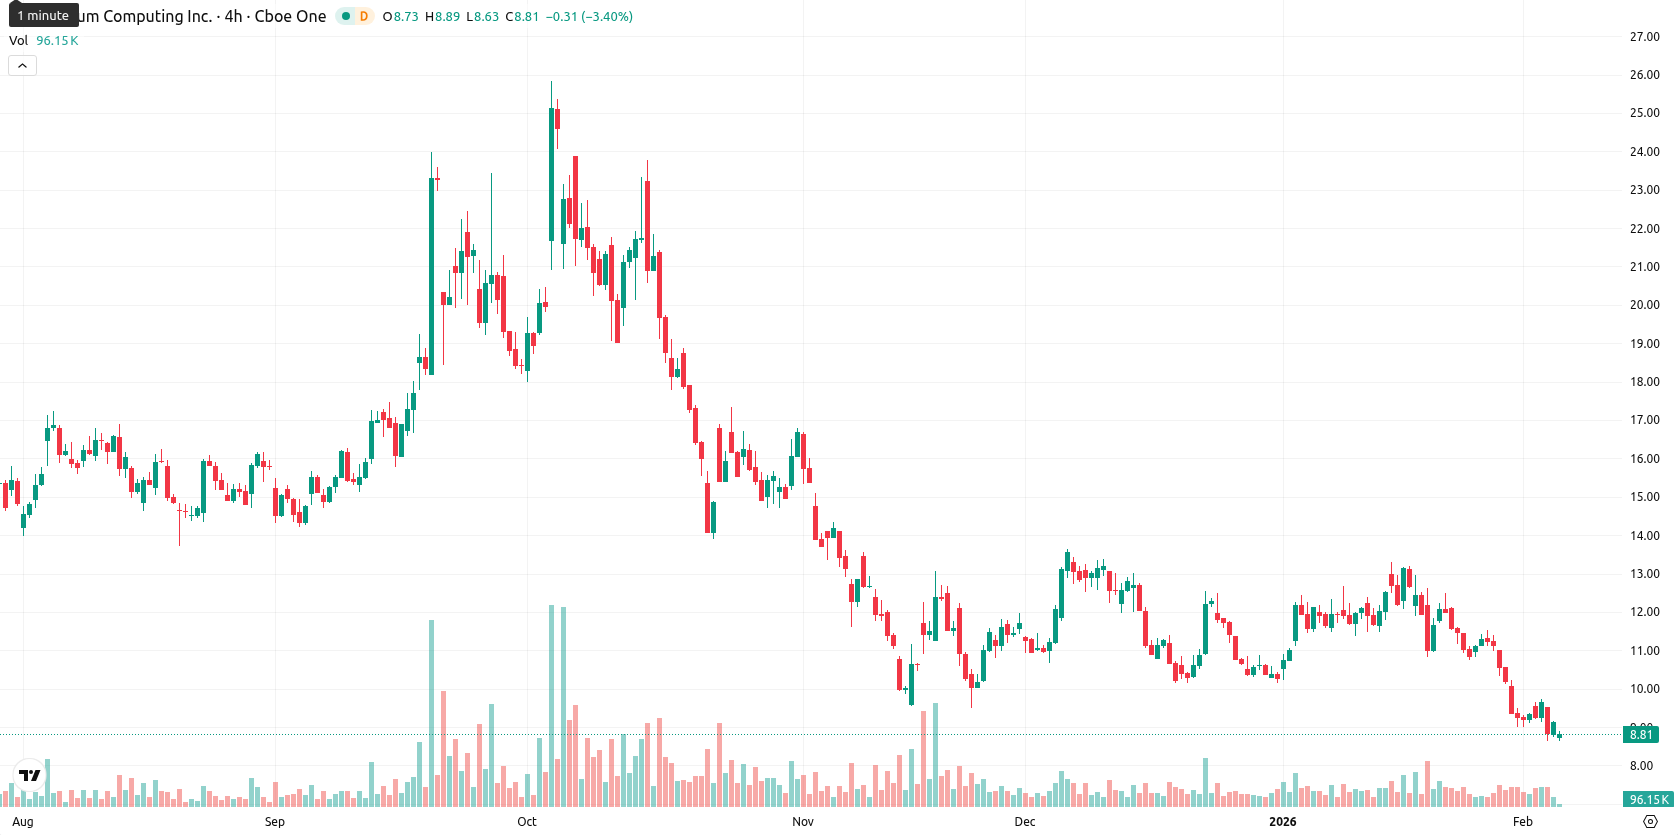
Quantum Computing Inc. (QUBT) is trading at $8.76, which is well below the MA-20 ($11.22), MA-50 ($11.42), and MA-200 ($14.31), highlighting strong short-, medium-, and long-term bearish pressure. The nearest dynamic resistance is the Ichimoku Kijun at $10.97, with no nearby dynamic support indicated above the current price.
Highlights
- Quantum Computing Inc. ($QUBT) is trading at $8.76, significantly below its MA-20 ($11.22), MA-50 ($11.42), and MA-200 ($14.31), indicating entrenched bearish pressure across all timeframes.
- Oversold oscillators—RSI (35.63), Stochastic RSI (2.97), and CCI (-161.28)—point to persistent seller dominance, with no clear bullish reversal signal emerging.
- Immediate resistance is located at the Ichimoku Kijun ($10.97), while a breach below $8.77 could trigger further downside, with a projected 5-day range of $7.90–$9.60.
Oversold signals persist as downward momentum and pressure dominate
Momentum signals are firmly negative, with both MACD and ADX on the daily chart pointing to ongoing weakness and limited trend strength. Oversold conditions are evident across RSI (35.63), Stochastic RSI (2.97), and CCI (-161.28), but Bull/Bear Power remains deeply negative (-0.93), confirming that sellers continue to dominate intraday action. The Awesome Oscillator also aligns with the overall bearish direction. Today’s session shows a gap down from the previous close ($9.13) to the open ($8.77), with prices now stuck near the session lows in a very tight intraday range ($8.77 – $8.82), reflecting low volatility and sustained pressure after the open. While momentum and oscillators both indicate oversold conditions, neither shows signs of bullish reversal yet, underscoring persistent downward momentum.
Downside risk prevails as bullish reversal signals remain absent
Looking ahead, the expected 5-day price range is normalized to $7.90 – $9.60, bracketing the current price and reflecting typical volatility for a weakly trending asset. There is a very low probability (less than 20%) of a meaningful price increase, with a downward move more likely given all key weekly and daily signals from Moving Averages, RSI, ADX, and MACD. Baseline scenario sees QUBT remaining in a narrow sideways channel. A bullish scenario would require a strong recovery above resistance at $10.97, which is not currently supported by momentum or trend signals, while a bearish scenario could see further downside if $8.77 is breached as oversold conditions persist without reversal.
Previously it was reported that Quantum Computing Inc. (QUBT) remains under sustained downward pressure, trading well below its key moving averages, with persistent resistance around technical benchmarks and no immediate support above the current price. Momentum and oscillator indicators, including MACD and RSI, continue to reflect oversold conditions and bearish dominance, indicating limited upside potential unless momentum shifts significantly.


Latest Quantum Computing News


-
 Afghanistan
-
 Albania
-
 Algeria
-
 Angola
-
 Argentina
-
 Armenia
-
 Australia
-
 Austria
-
 Azerbaijan
-
 Bahamas
-
 Bahrain
-
 Bangladesh
-
 Belarus
-
 Belgium
-
 Bolivia
-
 Botswana
-
 Brazil
-
 Brunei
-
 Bulgaria
-
 Cambodia
-
 Cameroon
-
 Canada
-
 Chile
Chile
-
 China
China
-
 Colombia
-
 Congo
Congo
-
 Costa Rica
-
 Cote d'Ivoire
-
 Croatia
-
 Cuba
Cuba
-
 Cyprus
-
 Czechia
-
 DR Congo
-
 Denmark
-
 Dominican Republic
-
 Ecuador
-
 Egypt
Egypt
-
 El Salvador
-
 Estonia
-
 Eswatini
-
 Ethiopia
-
 Finland
-
 France
-
 Georgia
-
 Germany
-
 Ghana
Ghana
-
 Greece
-
 Haiti
Haiti
-
 Hong Kong
-
 Hungary
-
 India
India
-
 Indonesia
-
 Iran, Islamic republic
-
 Iraq
Iraq
-
 Ireland
-
 Israel
-
 Italy
Italy
-
 Jamaica
-
 Japan
Japan
-
 Jordan
-
 Kazakhstan
-
 Kenya
Kenya
-
 Korea
Korea
-
 Kuwait
-
 Kyrgyzstan
-
 Laos
Laos
-
 Latvia
-
 Lebanon
-
 Lesotho
-
 Libya
Libya
-
 Lithuania
-
 Luxembourg
-
 Madagascar
-
 Malaysia
-
 Malta
Malta
-
 Mauritius
-
 Mexico
-
 Moldova
-
 Mongolia
-
 Montenegro
-
 Morocco
-
 Mozambique
-
 Myanmar
-
 Namibia
-
 Nepal
Nepal
-
 Netherlands
-
 New Zealand
-
 Nigeria
-
 North Macedonia
-
 Norway
-
 Oman
Oman
-
 Pakistan
-
 Palestine
-
 Panama
-
 Papua New Guinea
-
 Paraguay
-
 Peru
Peru
-
 Philippines
-
 Poland
-
 Portugal
-
 Puerto Rico
-
 Qatar
Qatar
-
 Reunion
-
 Romania
-
 Rwanda
-
 Saudi Arabia
-
 Serbia
-
 Singapore
-
 Slovakia
-
 Slovenia
-
 Somalia
-
 South Africa
-
 Spain
Spain
-
 Sri Lanka
-
 Sweden
-
 Switzerland
-
 Syria
Syria
-
 Taiwan
-
 Tajikistan
-
 Tanzania
-
 Thailand
-
 Trinidad and Tobago
-
 Tunisia
-
 Turkey
-
 UAE
UAE
-
 Uganda
-
 Ukraine
-
 United Kingdom
-
United States
-
 Uruguay
-
 Uzbekistan
-
 Venezuela
-
 Vietnam
-
 Yemen
Yemen
-
 Zambia
-
 Zimbabwe
- Forex
- Crypto
