
Nano Dimension stock rises 3.41% as traders eye bullish breakout above $1.83

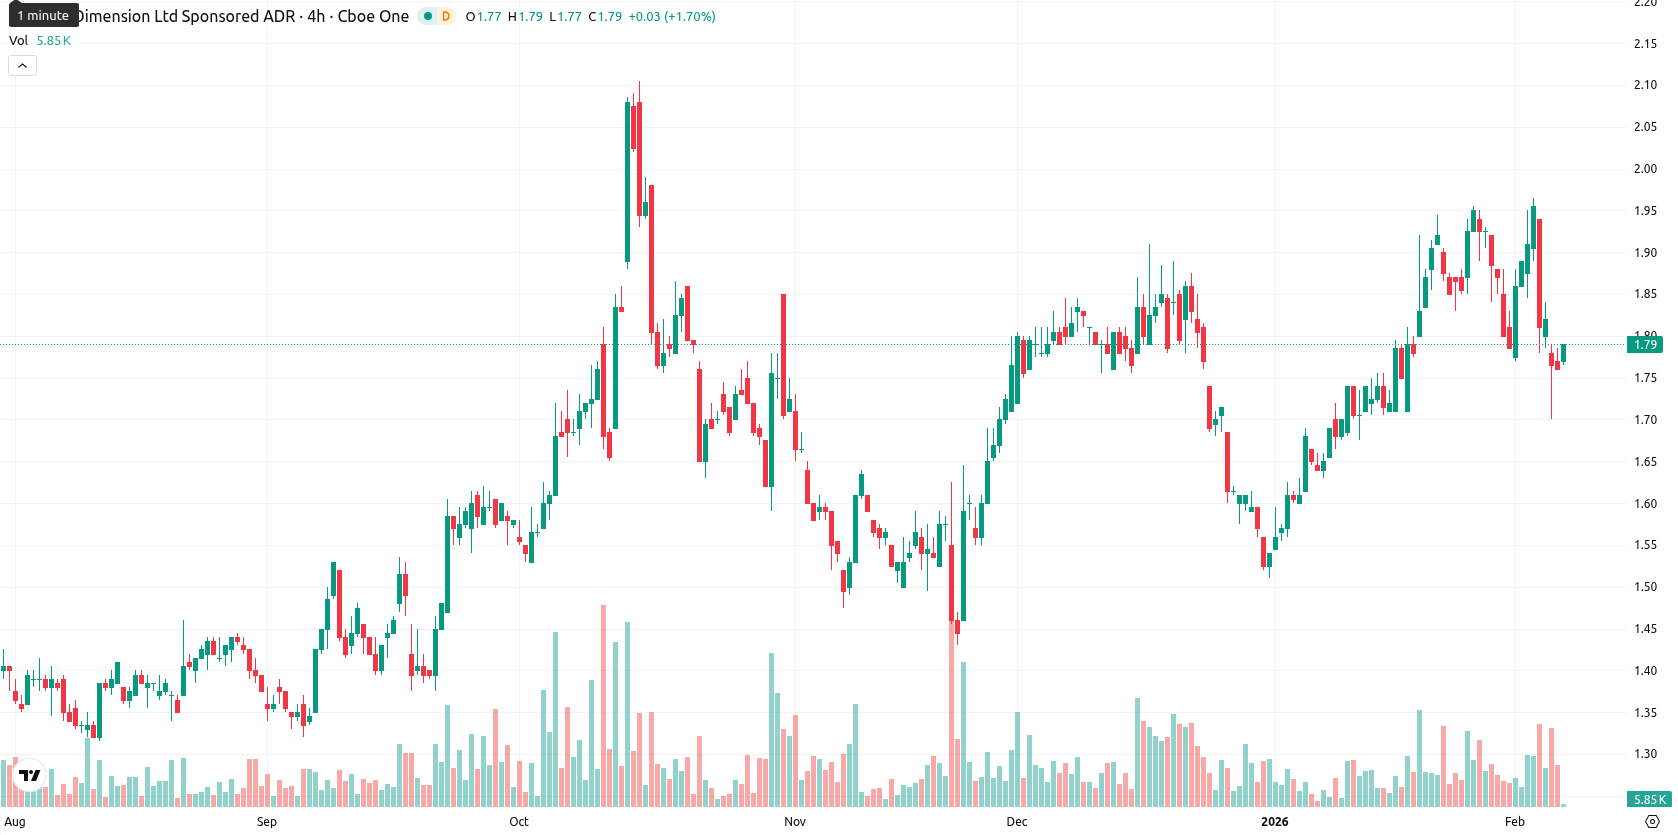
Nano Dimension Ltd (NNDM) is trading at $1.82, which places it just above both the MA-20 ($1.81) and MA-50 ($1.76), confirming a near-term bullish tone while remaining well above the MA-200 ($1.59), indicating robust long-term support. The price is currently holding above the Ichimoku Kijun at $1.74, with the nearest dynamic resistance now aligning with the MA-50 and the $1.85 round level.
Highlights
- Nano Dimension (NNDM) is trading at $1.82, just above the MA-20 ($1.81) and MA-50 ($1.76), indicating a short-term bullish bias.
- Momentum indicators are mixed: MACD and ADX signal buying strength, while RSI (47.44, Sell) and CCI (-50.14, Sell) suggest oversold conditions and potential short-term exhaustion.
- A bullish breakout above $1.83 may target resistance at $1.85–$1.90, while support levels sit at $1.81, $1.76, and $1.74 for the coming week.
Momentum shifts as conflicting indicators temper intraday gains
Momentum indicators on the daily chart present mixed signals: the MACD signals Strong Buy while the ADX also supports further upside, pointing to strengthening momentum. However, classic oscillators such as the RSI (47.44, Sell), Stochastic RSI (Oversold), and CCI (-50.14, Sell) indicate a tendency toward oversold conditions and possible short-term exhaustion, with Bull/Bear Power giving a Sell forecast and underscoring continuing intraday seller dominance. The Awesome Oscillator remains neutral. Today’s price action opened fractionally above the previous close (no meaningful gap), and price is trading near the upper end of today’s range ($1.77 – $1.80) with moderate intraday volatility and a +3.41% gain so far, reflecting some strength toward highs despite underlying oscillator divergence.
Sideways bias expected as high upside odds meet consolidation
For the coming week, the expected price range is $1.81 to $1.83. The calculated probability of an upward move is very high (more than 80%), making a downward move much less likely. The baseline scenario calls for sideways consolidation in this narrow corridor as the price absorbs recent momentum and overbought signals. A bullish breakout above $1.83 could accelerate buying toward higher resistance near $1.85 – $1.90, while a bearish break below $1.81 may trigger renewed selling to longer-term supports around $1.76 – $1.74.
Previously it was reported that Nano Dimension Ltd. (NNDM) trades above major moving averages, indicating a bullish trend across all timeframes, with immediate support near $1.74 and resistance at $1.85. Momentum indicators including MACD, ADX, and RSI remain positive and show buyers in control, though intraday price action reveals short-term weakness despite underlying bullish signals.


Latest Nano Dimension News


-
 Afghanistan
-
 Albania
-
 Algeria
-
 Angola
-
 Argentina
-
 Armenia
-
 Australia
-
 Austria
-
 Azerbaijan
-
 Bahamas
-
 Bahrain
-
 Bangladesh
-
 Belarus
-
 Belgium
-
 Bolivia
-
 Botswana
-
 Brazil
-
 Brunei
-
 Bulgaria
-
 Cambodia
-
 Cameroon
-
 Canada
-
 Chile
Chile
-
 China
China
-
 Colombia
-
 Congo
Congo
-
 Costa Rica
-
 Cote d'Ivoire
-
 Croatia
-
 Cuba
Cuba
-
 Cyprus
-
 Czechia
-
 DR Congo
-
 Denmark
-
 Dominican Republic
-
 Ecuador
-
 Egypt
Egypt
-
 El Salvador
-
 Estonia
-
 Eswatini
-
 Ethiopia
-
 Finland
-
 France
-
 Georgia
-
 Germany
-
 Ghana
Ghana
-
 Greece
-
 Haiti
Haiti
-
 Hong Kong
-
 Hungary
-
 India
India
-
 Indonesia
-
 Iran, Islamic republic
-
 Iraq
Iraq
-
 Ireland
-
 Israel
-
 Italy
Italy
-
 Jamaica
-
 Japan
Japan
-
 Jordan
-
 Kazakhstan
-
 Kenya
Kenya
-
 Korea
Korea
-
 Kuwait
-
 Kyrgyzstan
-
 Laos
Laos
-
 Latvia
-
 Lebanon
-
 Lesotho
-
 Libya
Libya
-
 Lithuania
-
 Luxembourg
-
 Madagascar
-
 Malaysia
-
 Malta
Malta
-
 Mauritius
-
 Mexico
-
 Moldova
-
 Mongolia
-
 Montenegro
-
 Morocco
-
 Mozambique
-
 Myanmar
-
 Namibia
-
 Nepal
Nepal
-
 Netherlands
-
 New Zealand
-
 Nigeria
-
 North Macedonia
-
 Norway
-
 Oman
Oman
-
 Pakistan
-
 Palestine
-
 Panama
-
 Papua New Guinea
-
 Paraguay
-
 Peru
Peru
-
 Philippines
-
 Poland
-
 Portugal
-
 Puerto Rico
-
 Qatar
Qatar
-
 Reunion
-
 Romania
-
 Rwanda
-
 Saudi Arabia
-
 Serbia
-
 Singapore
-
 Slovakia
-
 Slovenia
-
 Somalia
-
 South Africa
-
 Spain
Spain
-
 Sri Lanka
-
 Sweden
-
 Switzerland
-
 Syria
Syria
-
 Taiwan
-
 Tajikistan
-
 Tanzania
-
 Thailand
-
 Trinidad and Tobago
-
 Tunisia
-
 Turkey
-
 UAE
UAE
-
 Uganda
-
 Ukraine
-
 United Kingdom
-
United States
-
 Uruguay
-
 Uzbekistan
-
 Venezuela
-
 Vietnam
-
 Yemen
Yemen
-
 Zambia
-
 Zimbabwe
- Forex
- Crypto
