
+5.07% for Hut 8 stock — mixed technical momentum meets sustained bullish structure

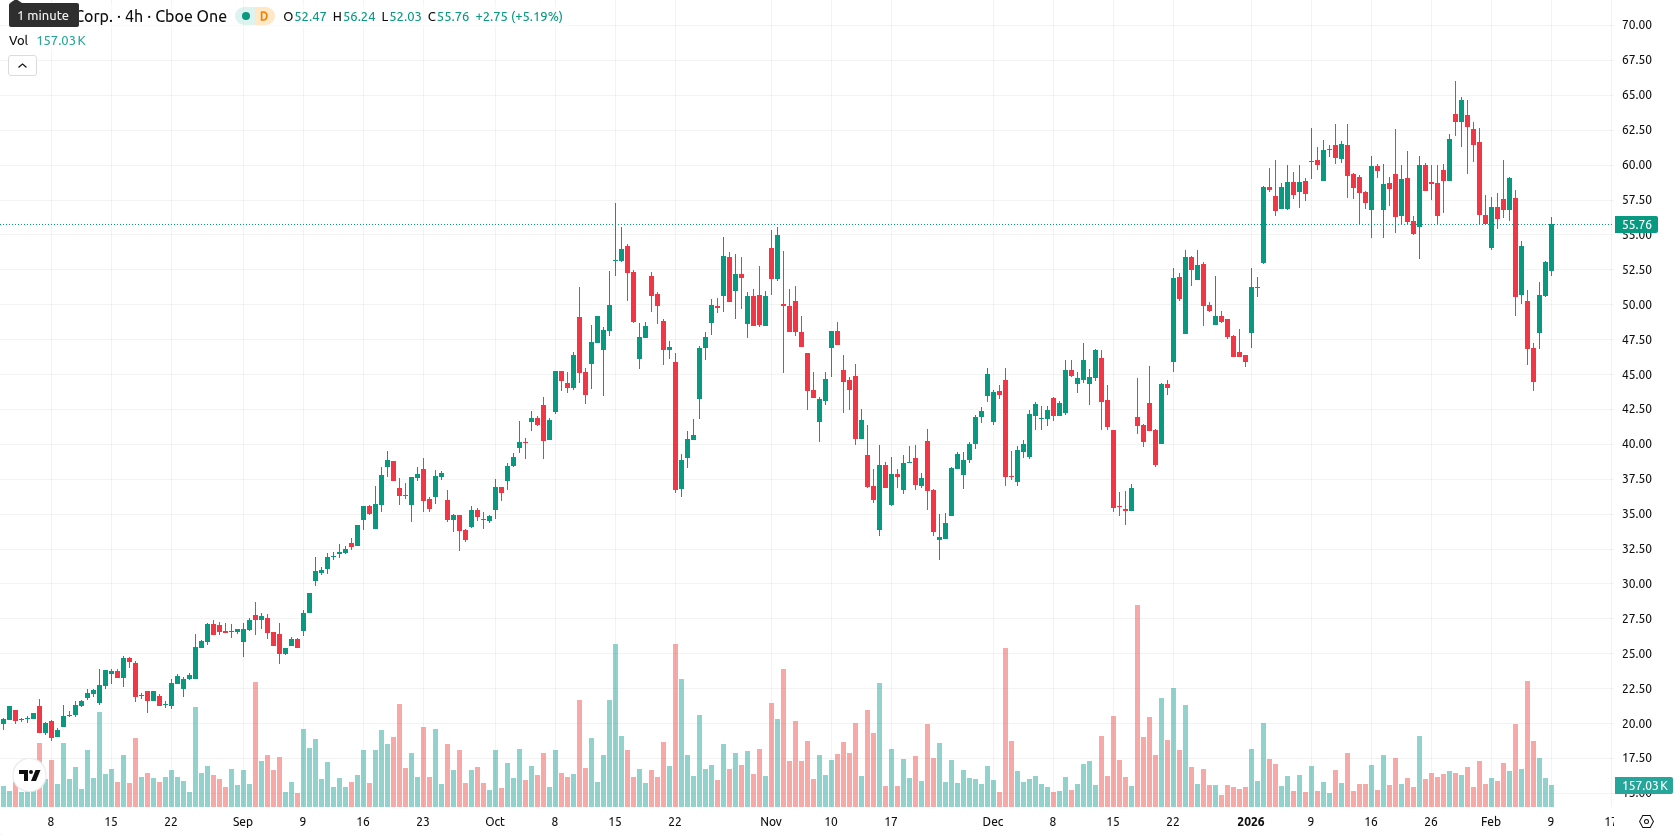
Hut 8 Corp (HUT) is trading at $55.75, positioned below the MA-20 ($57.78), above the MA-50 ($50.73), and well above the MA-200 ($33.17). This setup indicates lingering short-term seller pressure but sustained medium- and long-term bullish structure, with the nearest dynamic support at the Ichimoku Kijun ($54.94) and resistance at the MA-20 ($57.78).
Highlights
- HUT trades at $55.75, below the MA-20 ($57.78) but above the MA-50 ($50.73) and MA-200 ($33.17), reflecting medium- and long-term bullish structure.
- Mixed daily momentum signals reveal intraday seller dominance with RSI showing pressure and the Commodity Channel Index oversold, but Stochastic RSI flashing a strong buy.
- Key support stands at the Ichimoku Kijun ($54.94), with resistance at MA-20 ($57.78); 5-day range expected at $53.40–$61.32 and price rise probability above 80%.
Intraday strength diverges from mixed and oversold momentum signals
Momentum signals on the daily chart are mixed: the MACD and ADX indicate neutral momentum, while the Relative Strength Index aligns with seller pressure, and Commodity Channel Index and Bull/Bear Power both register as oversold, highlighting clear intraday seller dominance. The Stochastic RSI points to a strong buy, adding divergence to the overall picture and reflecting uncertain direction, though intraday price action reveals strength, rising $2.69 (+5.07%) from the previous close and opening just slightly below it, suggesting no significant gap. The price is currently near today’s high, pointing to high volatility and sustained strength toward the top of the daily trading range, somewhat at odds with the generally cautious momentum signals.
Upside breakout favored amid narrow consolidation and high support
For the next five trading days, the expected price range is $53.40 to $61.32. The probability of a price increase is very high (more than 80%), with a price decrease considered much less likely. The baseline scenario envisions the price consolidating in a sideways corridor near current levels. A bullish scenario could see HUT break through the $57.78 resistance, targeting new highs above $61. In the bearish case, a move below the $54.94 – $53.40 support zone may trigger further downside volatility.
Previously it was reported that Hut 8 Corp. is trading above its medium- and long-term moving averages, signaling ongoing structural bullishness, but remains just under short-term moving average resistance, suggesting near-term seller pressure. Momentum and oscillator indicators present a mixed outlook—while price action is resilient and supported near dynamic levels, muted trend strength and mild overbought signals highlight potential short-term headwinds.


Latest Hut 8 News


-
 Afghanistan
-
 Albania
-
 Algeria
-
 Angola
-
 Argentina
-
 Armenia
-
 Australia
-
 Austria
-
 Azerbaijan
-
 Bahamas
-
 Bahrain
-
 Bangladesh
-
 Belarus
-
 Belgium
-
 Bolivia
-
 Botswana
-
 Brazil
-
 Brunei
-
 Bulgaria
-
 Cambodia
-
 Cameroon
-
 Canada
-
 Chile
Chile
-
 China
China
-
 Colombia
-
 Congo
Congo
-
 Costa Rica
-
 Cote d'Ivoire
-
 Croatia
-
 Cuba
Cuba
-
 Cyprus
-
 Czechia
-
 DR Congo
-
 Denmark
-
 Dominican Republic
-
 Ecuador
-
 Egypt
Egypt
-
 El Salvador
-
 Estonia
-
 Eswatini
-
 Ethiopia
-
 Finland
-
 France
-
 Georgia
-
 Germany
-
 Ghana
Ghana
-
 Greece
-
 Haiti
Haiti
-
 Hong Kong
-
 Hungary
-
 India
India
-
 Indonesia
-
 Iran, Islamic republic
-
 Iraq
Iraq
-
 Ireland
-
 Israel
-
 Italy
Italy
-
 Jamaica
-
 Japan
Japan
-
 Jordan
-
 Kazakhstan
-
 Kenya
Kenya
-
 Korea
Korea
-
 Kuwait
-
 Kyrgyzstan
-
 Laos
Laos
-
 Latvia
-
 Lebanon
-
 Lesotho
-
 Libya
Libya
-
 Lithuania
-
 Luxembourg
-
 Madagascar
-
 Malaysia
-
 Malta
Malta
-
 Mauritius
-
 Mexico
-
 Moldova
-
 Mongolia
-
 Montenegro
-
 Morocco
-
 Mozambique
-
 Myanmar
-
 Namibia
-
 Nepal
Nepal
-
 Netherlands
-
 New Zealand
-
 Nigeria
-
 North Macedonia
-
 Norway
-
 Oman
Oman
-
 Pakistan
-
 Palestine
-
 Panama
-
 Papua New Guinea
-
 Paraguay
-
 Peru
Peru
-
 Philippines
-
 Poland
-
 Portugal
-
 Puerto Rico
-
 Qatar
Qatar
-
 Reunion
-
 Romania
-
 Rwanda
-
 Saudi Arabia
-
 Serbia
-
 Singapore
-
 Slovakia
-
 Slovenia
-
 Somalia
-
 South Africa
-
 Spain
Spain
-
 Sri Lanka
-
 Sweden
-
 Switzerland
-
 Syria
Syria
-
 Taiwan
-
 Tajikistan
-
 Tanzania
-
 Thailand
-
 Trinidad and Tobago
-
 Tunisia
-
 Turkey
-
 UAE
UAE
-
 Uganda
-
 Ukraine
-
 United Kingdom
-
United States
-
 Uruguay
-
 Uzbekistan
-
 Venezuela
-
 Vietnam
-
 Yemen
Yemen
-
 Zambia
-
 Zimbabwe
- Forex
- Crypto
