
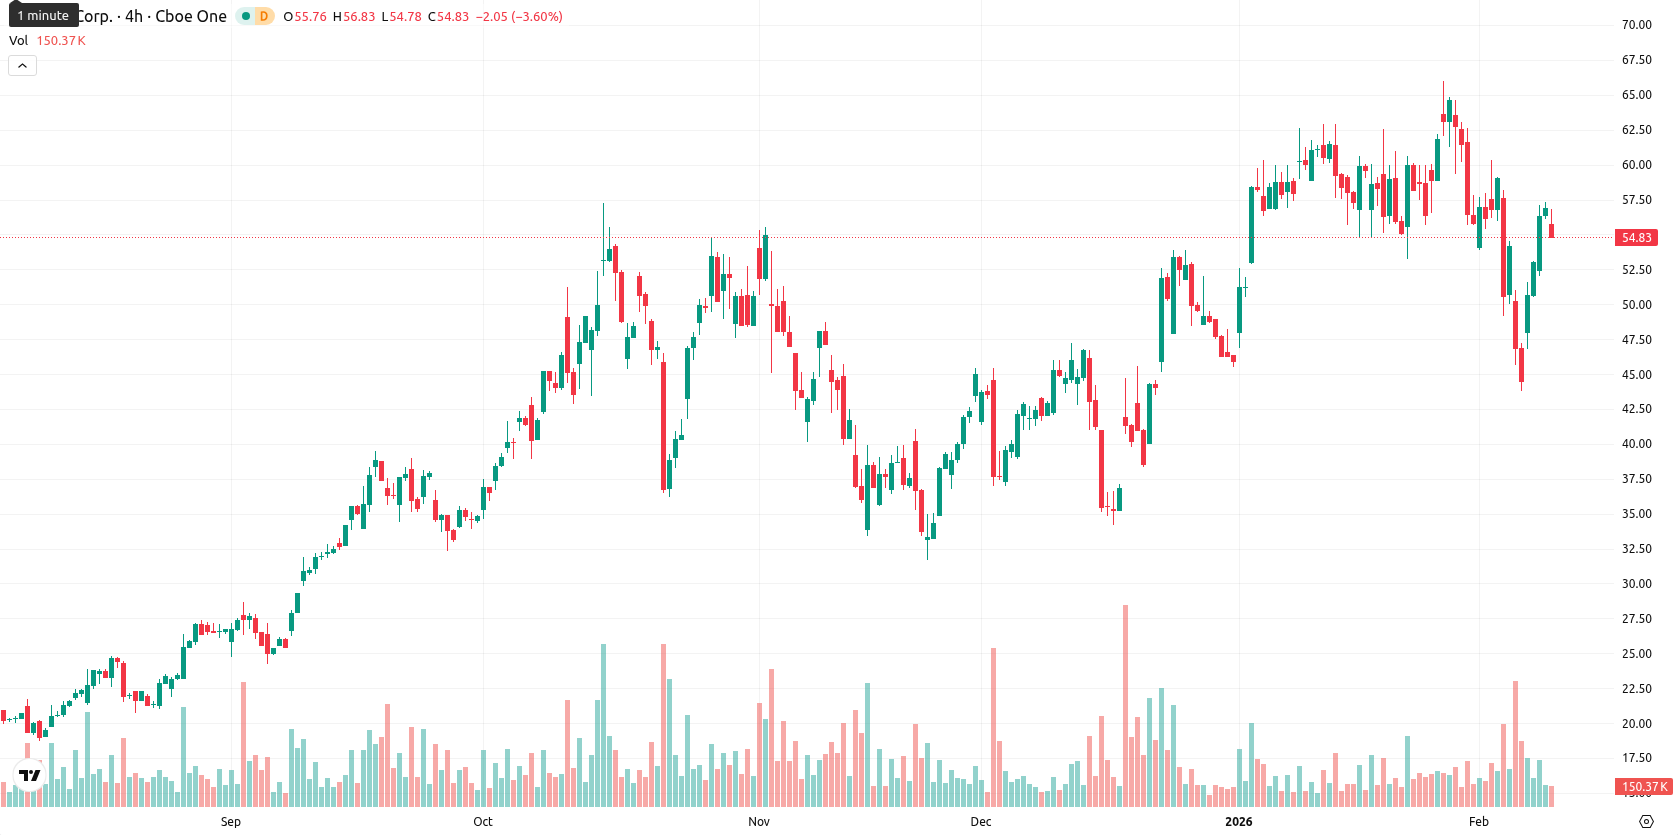
Hut 8 stock: Diverging momentum and oscillators drive a 3.74% decline

Hut 8 Corp (HUT) is trading at $54.77, down 3.74% on the day. The price is below the MA-20 ($57.62) but remains above both the MA-50 ($51.07) and MA-200 ($33.40), indicating near-term seller pressure set within a medium- to long-term bullish trend.
Highlights
- HUT trades at $54.77, below the MA-20 ($57.62) but above the MA-50 ($51.07) and MA-200 ($33.40), indicating near-term selling in a medium-term bullish setup.
- The MACD signals strong upward momentum while mixed readings from the ADX, RSI, and Stochastic RSI reflect near-term uncertainty and moderate-to-high intraday volatility.
- For the coming week, HUT is expected to consolidate between $52.50 support and $57.50 resistance, with over an 80% probability of upward price movement.
Momentum divergence and resistance at Kijun level fuel short-term uncertainty
Technically, HUT is positioned just below the Ichimoku Kijun level at $54.94, which serves as dynamic resistance, while the MA-50 at $51.07 offers initial support. Momentum indicators are mixed: the MACD shows strong upward momentum, the ADX is neutral indicating trend uncertainty, and the RSI is modestly bullish. The Stochastic RSI is neutral and the CCI leans slightly bearish; Bull/Bear Power signals an overbought environment, confirming intraday buyer dominance. Despite moderate to high volatility and early session selling pressure, diverging signals between momentum and oscillators highlight short-term uncertainty against a structurally bullish backdrop.
Bullish bias for week ahead as technicals favor consolidation
Over the next week, HUT is likely to trade within a typical volatility band of $52.50 to $57.50. Technical readings — notably weekly RSI, MACD, ADX, and moving averages — suggest a greater than 80% probability of upward movement, reducing the chances of further decline. The likely scenario is consolidation between identified support and resistance; a close above the Ichimoku Kijun could enable a move towards $57.50, while sustained trading below $52.50 may lead to increased short-term selling.
Previously it was reported that Hut 8 Corp. is trading below its short-term moving average but remains above key medium- and long-term averages, reflecting ongoing short-term selling pressure within an overall bullish framework. Momentum indicators are mixed, with bullish signals from MACD and RSI countered by weakening intraday action, as support is established near $54.94 and resistance near $57.00.


Latest Hut 8 News


-
 Afghanistan
-
 Albania
-
 Algeria
-
 Angola
-
 Argentina
-
 Armenia
-
 Australia
-
 Austria
-
 Azerbaijan
-
 Bahamas
-
 Bahrain
-
 Bangladesh
-
 Belarus
-
 Belgium
-
 Bolivia
-
 Botswana
-
 Brazil
-
 Brunei
-
 Bulgaria
-
 Cambodia
-
 Cameroon
-
 Canada
-
 Chile
Chile
-
 China
China
-
 Colombia
-
 Congo
Congo
-
 Costa Rica
-
 Cote d'Ivoire
-
 Croatia
-
 Cuba
Cuba
-
 Cyprus
-
 Czechia
-
 DR Congo
-
 Denmark
-
 Dominican Republic
-
 Ecuador
-
 Egypt
Egypt
-
 El Salvador
-
 Estonia
-
 Eswatini
-
 Ethiopia
-
 Finland
-
 France
-
 Georgia
-
 Germany
-
 Ghana
Ghana
-
 Greece
-
 Haiti
Haiti
-
 Hong Kong
-
 Hungary
-
 India
India
-
 Indonesia
-
 Iran, Islamic republic
-
 Iraq
Iraq
-
 Ireland
-
 Israel
-
 Italy
Italy
-
 Jamaica
-
 Japan
Japan
-
 Jordan
-
 Kazakhstan
-
 Kenya
Kenya
-
 Korea
Korea
-
 Kuwait
-
 Kyrgyzstan
-
 Laos
Laos
-
 Latvia
-
 Lebanon
-
 Lesotho
-
 Libya
Libya
-
 Lithuania
-
 Luxembourg
-
 Madagascar
-
 Malaysia
-
 Malta
Malta
-
 Mauritius
-
 Mexico
-
 Moldova
-
 Mongolia
-
 Montenegro
-
 Morocco
-
 Mozambique
-
 Myanmar
-
 Namibia
-
 Nepal
Nepal
-
 Netherlands
-
 New Zealand
-
 Nigeria
-
 North Macedonia
-
 Norway
-
 Oman
Oman
-
 Pakistan
-
 Palestine
-
 Panama
-
 Papua New Guinea
-
 Paraguay
-
 Peru
Peru
-
 Philippines
-
 Poland
-
 Portugal
-
 Puerto Rico
-
 Qatar
Qatar
-
 Reunion
-
 Romania
-
 Rwanda
-
 Saudi Arabia
-
 Serbia
-
 Singapore
-
 Slovakia
-
 Slovenia
-
 Somalia
-
 South Africa
-
 Spain
Spain
-
 Sri Lanka
-
 Sweden
-
 Switzerland
-
 Syria
Syria
-
 Taiwan
-
 Tajikistan
-
 Tanzania
-
 Thailand
-
 Trinidad and Tobago
-
 Tunisia
-
 Turkey
-
 UAE
UAE
-
 Uganda
-
 Ukraine
-
 United Kingdom
-
United States
-
 Uruguay
-
 Uzbekistan
-
 Venezuela
-
 Vietnam
-
 Yemen
Yemen
-
 Zambia
-
 Zimbabwe
- Forex
- Crypto
