
Hut 8 stock price forecast: Sideways action likely as HUT slips 3.51%

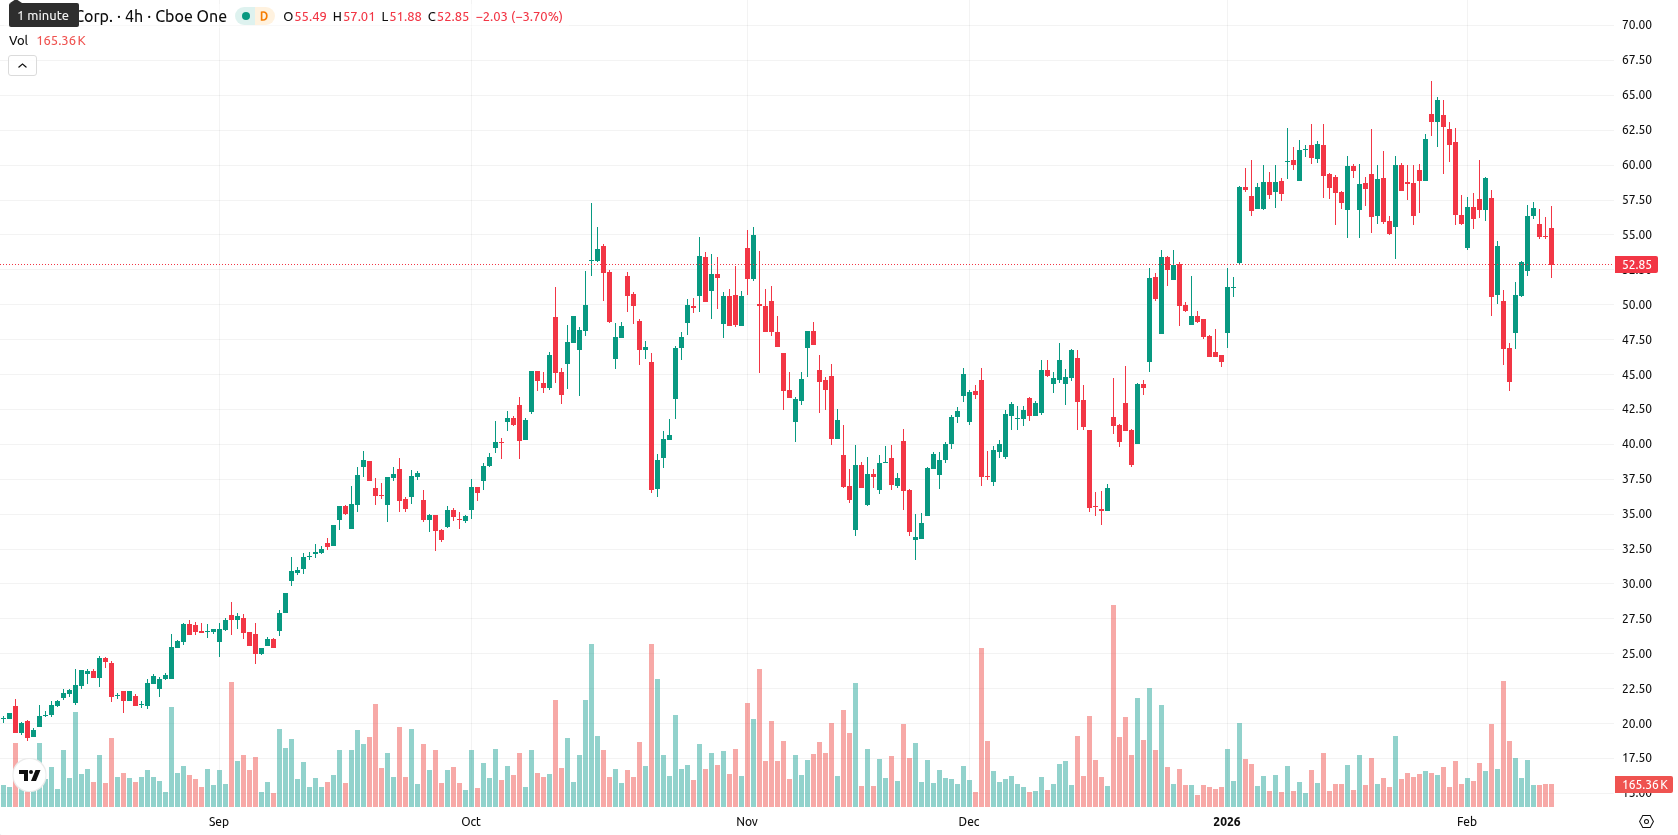
Hut 8 Corp (HUT) is currently trading at $52.98, sitting below the MA-20 ($57.31), just above the MA-50 ($51.32), and substantially higher than the MA-200 ($33.61). This setup highlights short-term pressure from sellers, moderate support in the medium term, and the ongoing long-term bullish trend.
Highlights
- HUT is trading at $52.98, below the MA-20 ($57.31), just above MA-50 ($51.32), and significantly above MA-200 ($33.61), indicating short-term weakness but long-term bullish structure.
- Daily momentum signals are mixed: MACD and most oscillators are neutral or negative, with RSI just under 50 suggesting slight sell bias despite persistent buyer domination in Bull/Bear Power.
- For the next 5 trading days, HUT is expected to fluctuate between $48.00 and $56.00, with an 80% probability of a price increase if buying pressure persists above $51.32 support.
Bearish intraday shift as buyer dominance diverges from neutral signals
Momentum signals on the daily chart are mixed: the MACD is neutral and the ADX shows a weak trend, while the RSI sits just under 50, indicating a slight sell bias. The Stochastic RSI and CCI are both neutral and do not show overbought or oversold extremes, but the Bull/Bear Power’s overbought reading of 1.11 points to persistent buyer dominance despite today’s -3.51% drop. The session opened slightly higher than the previous close (no real gap), but the current price is near today’s low in a rather wide intraday range, reflecting high volatility and clear seller pressure after the open. Most oscillators are neutral or negative, while short-term momentum suggests ongoing divergence, as intraday bearish sentiment contrasts with persistent underlying buyer interest seen in the Bull/Bear Power.
Sideways outlook with upside bias as volatility drives range
For the next 5 trading days, HUT is expected to fluctuate between $48.00 and $56.00, adjusted to reflect recent volatility. The probability of a price increase is high (80%), based on three out of four key weekly indicators (RSI, ADX, MACD, and MA-50) showing bullish signals, making a price decline correspondingly less likely. The baseline scenario is that price will oscillate sideways within this $48.00 – $56.00 volatility band, while a bullish scenario could see a breakout above $54.94 toward $56.00 if buying pressure persists; conversely, a bearish move below the $51.32 – $50.00 zone could trigger a slide toward $48.00 in case of continued seller dominance.
Last time, analysts noted that Hut 8 Corp. is trading below its short-term moving average while holding above intermediate and long-term averages, as sellers exert short-term pressure but the broader trend remains bullish. Technical momentum is mixed with the MACD neutral, RSI leaning bearish, and the price testing support near its 50-day moving average amid high volatility and persistent selling pressure.


Latest Hut 8 News


-
 Afghanistan
-
 Albania
-
 Algeria
-
 Angola
-
 Argentina
-
 Armenia
-
 Australia
-
 Austria
-
 Azerbaijan
-
 Bahamas
-
 Bahrain
-
 Bangladesh
-
 Belarus
-
 Belgium
-
 Bolivia
-
 Botswana
-
 Brazil
-
 Brunei
-
 Bulgaria
-
 Cambodia
-
 Cameroon
-
 Canada
-
 Chile
Chile
-
 China
China
-
 Colombia
-
 Congo
Congo
-
 Costa Rica
-
 Cote d'Ivoire
-
 Croatia
-
 Cuba
Cuba
-
 Cyprus
-
 Czechia
-
 DR Congo
-
 Denmark
-
 Dominican Republic
-
 Ecuador
-
 Egypt
Egypt
-
 El Salvador
-
 Estonia
-
 Eswatini
-
 Ethiopia
-
 Finland
-
 France
-
 Georgia
-
 Germany
-
 Ghana
Ghana
-
 Greece
-
 Haiti
Haiti
-
 Hong Kong
-
 Hungary
-
 India
India
-
 Indonesia
-
 Iran, Islamic republic
-
 Iraq
Iraq
-
 Ireland
-
 Israel
-
 Italy
Italy
-
 Jamaica
-
 Japan
Japan
-
 Jordan
-
 Kazakhstan
-
 Kenya
Kenya
-
 Korea
Korea
-
 Kuwait
-
 Kyrgyzstan
-
 Laos
Laos
-
 Latvia
-
 Lebanon
-
 Lesotho
-
 Libya
Libya
-
 Lithuania
-
 Luxembourg
-
 Madagascar
-
 Malaysia
-
 Malta
Malta
-
 Mauritius
-
 Mexico
-
 Moldova
-
 Mongolia
-
 Montenegro
-
 Morocco
-
 Mozambique
-
 Myanmar
-
 Namibia
-
 Nepal
Nepal
-
 Netherlands
-
 New Zealand
-
 Nigeria
-
 North Macedonia
-
 Norway
-
 Oman
Oman
-
 Pakistan
-
 Palestine
-
 Panama
-
 Papua New Guinea
-
 Paraguay
-
 Peru
Peru
-
 Philippines
-
 Poland
-
 Portugal
-
 Puerto Rico
-
 Qatar
Qatar
-
 Reunion
-
 Romania
-
 Rwanda
-
 Saudi Arabia
-
 Serbia
-
 Singapore
-
 Slovakia
-
 Slovenia
-
 Somalia
-
 South Africa
-
 Spain
Spain
-
 Sri Lanka
-
 Sweden
-
 Switzerland
-
 Syria
Syria
-
 Taiwan
-
 Tajikistan
-
 Tanzania
-
 Thailand
-
 Trinidad and Tobago
-
 Tunisia
-
 Turkey
-
 UAE
UAE
-
 Uganda
-
 Ukraine
-
 United Kingdom
-
United States
-
 Uruguay
-
 Uzbekistan
-
 Venezuela
-
 Vietnam
-
 Yemen
Yemen
-
 Zambia
-
 Zimbabwe
- Forex
- Crypto
