
Meta stock price forecast: Key resistance holds as META drops 1.53% and sellers remain in control

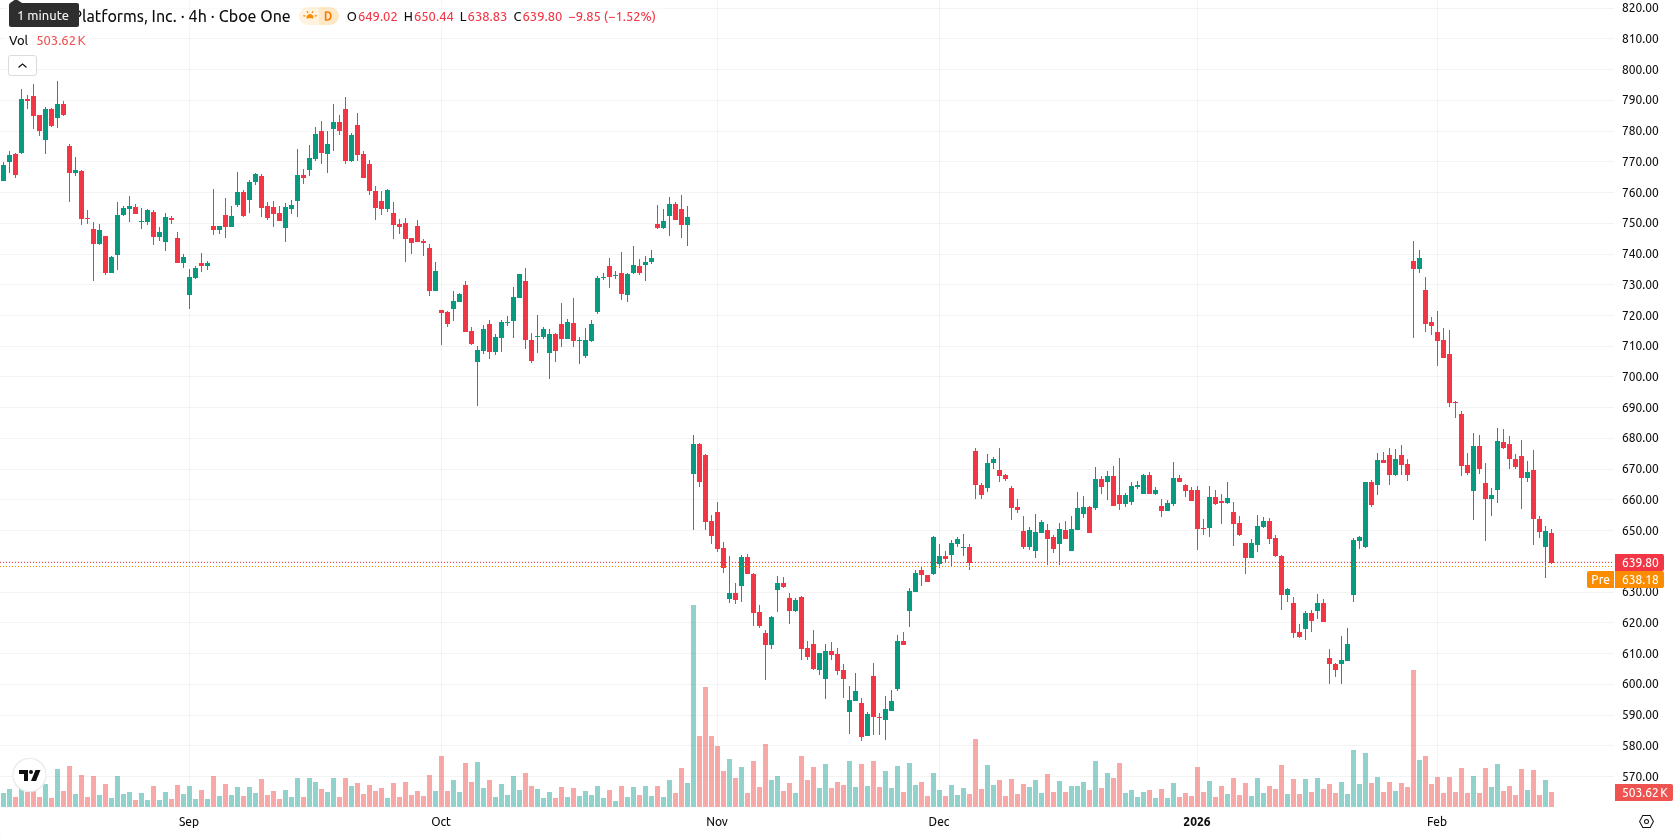
Meta Platforms, Inc. (META, formerly Facebook) is trading at $639.87 after a sharp $9.94 drop (down 1.53%) intraday. The price sits below the MA-20 ($665.95), MA-50 ($658.24), and MA-200 ($688.88), underscoring sustained bearish signals across all major timeframes.
Highlights
- META trades below the MA-20 ($665.95), MA-50 ($658.24), and MA-200 ($688.88), indicating persistent short-, medium-, and long-term bearish pressure.
- Momentum indicators including daily MACD (negative), RSI (42.71), and Commodity Channel Index (-70.32) point to seller-dominated, oversold conditions.
- Expected price range for the next five days is $630 to $655, with downside risk dominant and a probability of price increase below 20%.
Oversold signals persist as support holds and volatility rises
META is positioned below its near-term, medium, and long-term moving averages, revealing solid downward pressure. Key technical levels are resistance at the Ichimoku Kijun ($672.00) and support near both today’s low and the $635 zone. Momentum indicators reflect continued weakness: the daily MACD sits neutral but negative, ADX is low, and both RSI (42.71) and CCI (-70.32) suggest selling dominates. Stochastic RSI and Bull/Bear Power confirm oversold and seller-driven conditions, while the Awesome Oscillator is neutral, all matching with heightened volatility and persistent selling since the open.
Range-bound trading likely as breakout and rebound risks remain low
Over the next five trading days, the pricing scenario forecasts a typical volatility band between $630 and $655. The chance of a price rebound is low (under 20%), suggesting a sideways move inside this range is the most probable outcome. A bullish shift would require a sustained breakout above $655–$660, opening potential for a run toward $672.00, while a decisive dip below $630 could accelerate losses to the lower $620s.
Previously it was reported that Meta Platforms, Inc. is trading below key moving averages with technical indicators reflecting sustained selling pressure, oversold conditions, and weak momentum. With resistance near the Ichimoku Kijun and downside support at recent session lows, risk of further decline remains high unless the price reclaims higher technical levels.


Latest META News


-
 Afghanistan
-
 Albania
-
 Algeria
-
 Angola
-
 Argentina
-
 Armenia
-
 Australia
-
 Austria
-
 Azerbaijan
-
 Bahamas
-
 Bahrain
-
 Bangladesh
-
 Belarus
-
 Belgium
-
 Bolivia
-
 Botswana
-
 Brazil
-
 Brunei
-
 Bulgaria
-
 Cambodia
-
 Cameroon
-
 Canada
-
 Chile
Chile
-
 China
China
-
 Colombia
-
 Congo
Congo
-
 Costa Rica
-
 Cote d'Ivoire
-
 Croatia
-
 Cuba
Cuba
-
 Cyprus
-
 Czechia
-
 DR Congo
-
 Denmark
-
 Dominican Republic
-
 Ecuador
-
 Egypt
Egypt
-
 El Salvador
-
 Estonia
-
 Eswatini
-
 Ethiopia
-
 Finland
-
 France
-
 Georgia
-
 Germany
-
 Ghana
Ghana
-
 Greece
-
 Haiti
Haiti
-
 Hong Kong
-
 Hungary
-
 India
India
-
 Indonesia
-
 Iran, Islamic republic
-
 Iraq
Iraq
-
 Ireland
-
 Israel
-
 Italy
Italy
-
 Jamaica
-
 Japan
Japan
-
 Jordan
-
 Kazakhstan
-
 Kenya
Kenya
-
 Korea
Korea
-
 Kuwait
-
 Kyrgyzstan
-
 Laos
Laos
-
 Latvia
-
 Lebanon
-
 Lesotho
-
 Libya
Libya
-
 Lithuania
-
 Luxembourg
-
 Madagascar
-
 Malaysia
-
 Malta
Malta
-
 Mauritius
-
 Mexico
-
 Moldova
-
 Mongolia
-
 Montenegro
-
 Morocco
-
 Mozambique
-
 Myanmar
-
 Namibia
-
 Nepal
Nepal
-
 Netherlands
-
 New Zealand
-
 Nigeria
-
 North Macedonia
-
 Norway
-
 Oman
Oman
-
 Pakistan
-
 Palestine
-
 Panama
-
 Papua New Guinea
-
 Paraguay
-
 Peru
Peru
-
 Philippines
-
 Poland
-
 Portugal
-
 Puerto Rico
-
 Qatar
Qatar
-
 Reunion
-
 Romania
-
 Rwanda
-
 Saudi Arabia
-
 Serbia
-
 Singapore
-
 Slovakia
-
 Slovenia
-
 Somalia
-
 South Africa
-
 Spain
Spain
-
 Sri Lanka
-
 Sweden
-
 Switzerland
-
 Syria
Syria
-
 Taiwan
-
 Tajikistan
-
 Tanzania
-
 Thailand
-
 Trinidad and Tobago
-
 Tunisia
-
 Turkey
-
 UAE
UAE
-
 Uganda
-
 Ukraine
-
 United Kingdom
-
United States
-
 Uruguay
-
 Uzbekistan
-
 Venezuela
-
 Vietnam
-
 Yemen
Yemen
-
 Zambia
-
 Zimbabwe
- Forex
- Crypto
