
-1.53% for Meta stock — bearish momentum dominates amid weak oscillators and expense concerns

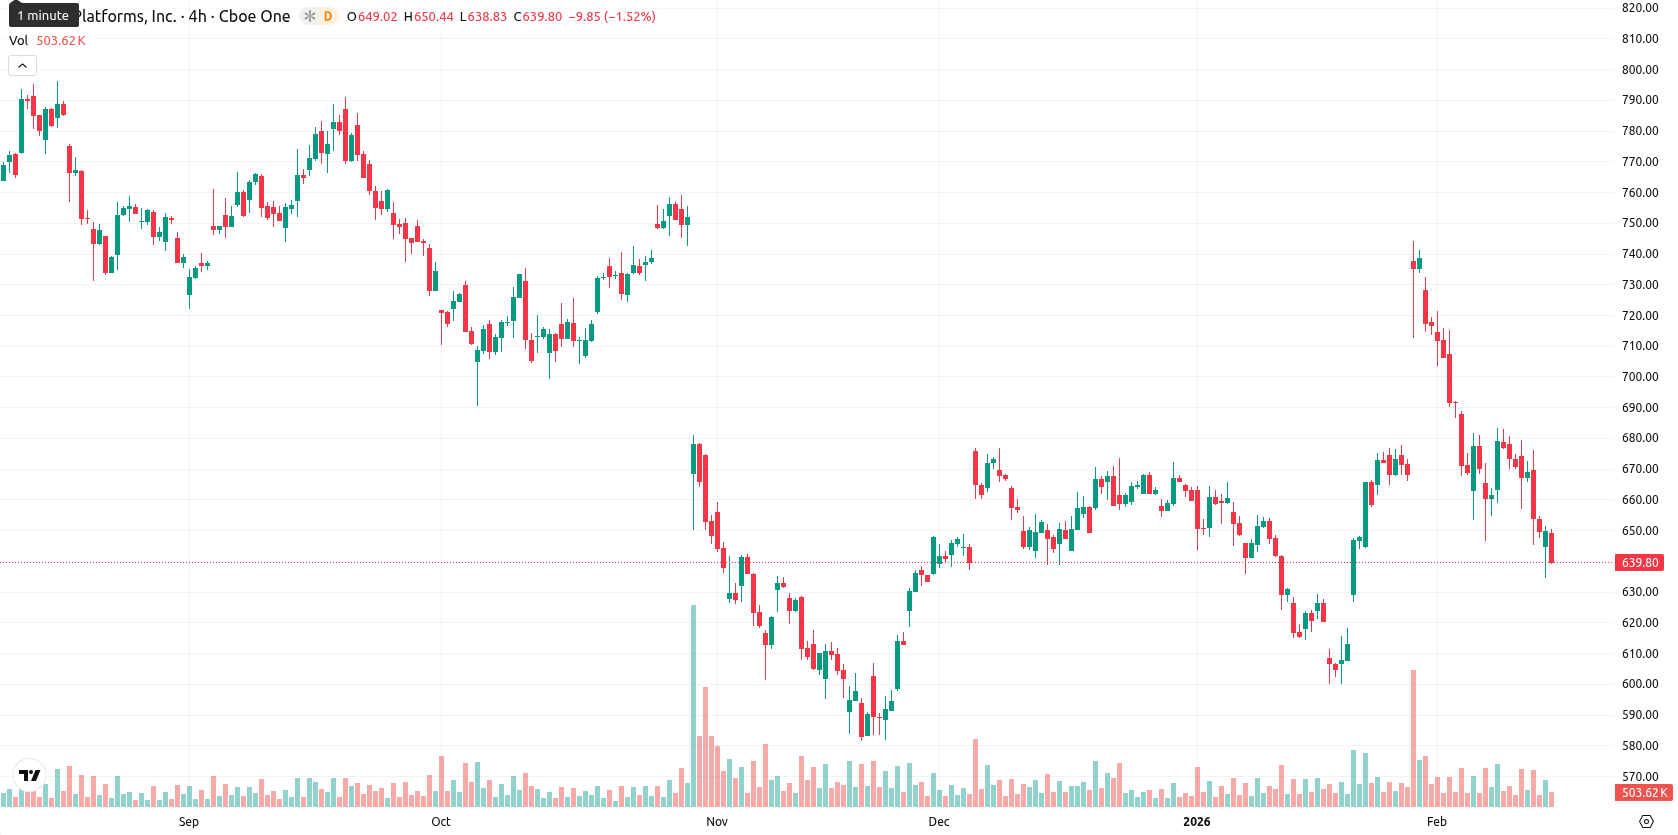
Meta Platforms, Inc. (META, formerly Facebook) is trading at $639.87, below the MA-20 ($665.95), MA-50 ($658.24), and MA-200 ($688.88), indicating persistent pressure from sellers across short-, medium-, and long-term trends. The closest dynamic resistance is around the Ichimoku Kijun level at $672.00, while support can be observed near the session low of $635.20.
Highlights
- Meta announced a $0.525 per share quarterly dividend, payable March 26, 2026, to shareholders of record as of March 16, 2026.
- Recent institutional activity showed both reductions and increases in Meta positions, while execution risks persist due to planned expense growth and ongoing Reality Labs losses.
- META trades at $639.87, below all key moving averages and support at $635.20, with technicals indicating high probability (>80%) of further downside toward $625.
Dividend announcement and fund rebalancing as execution risks persist
Meta has declared a quarterly dividend of $0.525 per share, payable on March 26, 2026 to shareholders of record as of March 16, 2026. There has also been notable institutional activity with several firms adjusting their holdings in the third quarter, including both reductions and increases in positions. Despite these actions, recent reports point to continued execution risks for Meta tied to planned expense growth and persistent Reality Labs losses.
Oversold signals and weak trend reinforce downside momentum
Momentum signals appear weak, as both the ADX and MACD on the daily chart are neutral, showing no trend strength but with a mild bearish tilt. Oscillators including the RSI (42.71, Sell), Stochastic RSI (Oversold at 0.00), CCI (Sell at -70.32), and Bull/Bear Power (Oversold, value -14.09) collectively reflect seller dominance and a clear oversold condition. There is no significant gap between the previous close ($649.81) and today’s open ($642.71). The current price sits near the lower end of today’s range, with moderate intraday volatility and continuing pressure after the open. Momentum and oscillators broadly confirm the intraday weakness, and the Awesome Oscillator does not contradict this trend.
Bearish outlook dominates as support breach risk intensifies
For the next five trading days, the expected price range is $625 to $652. The probability of a further price decrease is very high (more than 80%), while an increase is less likely. In the baseline scenario, price action is likely to remain sideways between the support and resistance levels. A bullish scenario would require a breakout above $652 and a close above the Ichimoku Kijun, while a bearish scenario would see sellers drive the price below $635, with the risk of an accelerated decline if this support is breached.
Previously it was reported that the Vatican’s financial strategy has evolved from aggressive, confidential investing toward a more transparent and ethically constrained approach, emphasizing stability and compliance with new rules that restrict speculative and controversial assets. Last time, analysts noted that while recent restructuring resulted in a short-term surplus and higher investment income, current trends suggest moderate, sustainable returns are now prioritized over past periods of exceptional growth.


Latest META News


-
 Afghanistan
-
 Albania
-
 Algeria
-
 Angola
-
 Argentina
-
 Armenia
-
 Australia
-
 Austria
-
 Azerbaijan
-
 Bahamas
-
 Bahrain
-
 Bangladesh
-
 Belarus
-
 Belgium
-
 Bolivia
-
 Botswana
-
 Brazil
-
 Brunei
-
 Bulgaria
-
 Cambodia
-
 Cameroon
-
 Canada
-
 Chile
Chile
-
 China
China
-
 Colombia
-
 Congo
Congo
-
 Costa Rica
-
 Cote d'Ivoire
-
 Croatia
-
 Cuba
Cuba
-
 Cyprus
-
 Czechia
-
 DR Congo
-
 Denmark
-
 Dominican Republic
-
 Ecuador
-
 Egypt
Egypt
-
 El Salvador
-
 Estonia
-
 Eswatini
-
 Ethiopia
-
 Finland
-
 France
-
 Georgia
-
 Germany
-
 Ghana
Ghana
-
 Greece
-
 Haiti
Haiti
-
 Hong Kong
-
 Hungary
-
 India
India
-
 Indonesia
-
 Iran, Islamic republic
-
 Iraq
Iraq
-
 Ireland
-
 Israel
-
 Italy
Italy
-
 Jamaica
-
 Japan
Japan
-
 Jordan
-
 Kazakhstan
-
 Kenya
Kenya
-
 Korea
Korea
-
 Kuwait
-
 Kyrgyzstan
-
 Laos
Laos
-
 Latvia
-
 Lebanon
-
 Lesotho
-
 Libya
Libya
-
 Lithuania
-
 Luxembourg
-
 Madagascar
-
 Malaysia
-
 Malta
Malta
-
 Mauritius
-
 Mexico
-
 Moldova
-
 Mongolia
-
 Montenegro
-
 Morocco
-
 Mozambique
-
 Myanmar
-
 Namibia
-
 Nepal
Nepal
-
 Netherlands
-
 New Zealand
-
 Nigeria
-
 North Macedonia
-
 Norway
-
 Oman
Oman
-
 Pakistan
-
 Palestine
-
 Panama
-
 Papua New Guinea
-
 Paraguay
-
 Peru
Peru
-
 Philippines
-
 Poland
-
 Portugal
-
 Puerto Rico
-
 Qatar
Qatar
-
 Reunion
-
 Romania
-
 Rwanda
-
 Saudi Arabia
-
 Serbia
-
 Singapore
-
 Slovakia
-
 Slovenia
-
 Somalia
-
 South Africa
-
 Spain
Spain
-
 Sri Lanka
-
 Sweden
-
 Switzerland
-
 Syria
Syria
-
 Taiwan
-
 Tajikistan
-
 Tanzania
-
 Thailand
-
 Trinidad and Tobago
-
 Tunisia
-
 Turkey
-
 UAE
UAE
-
 Uganda
-
 Ukraine
-
 United Kingdom
-
United States
-
 Uruguay
-
 Uzbekistan
-
 Venezuela
-
 Vietnam
-
 Yemen
Yemen
-
 Zambia
-
 Zimbabwe
- Forex
- Crypto
