
-3.39% for Texas Instruments stock — earnings momentum stalls despite bullish long-term trend

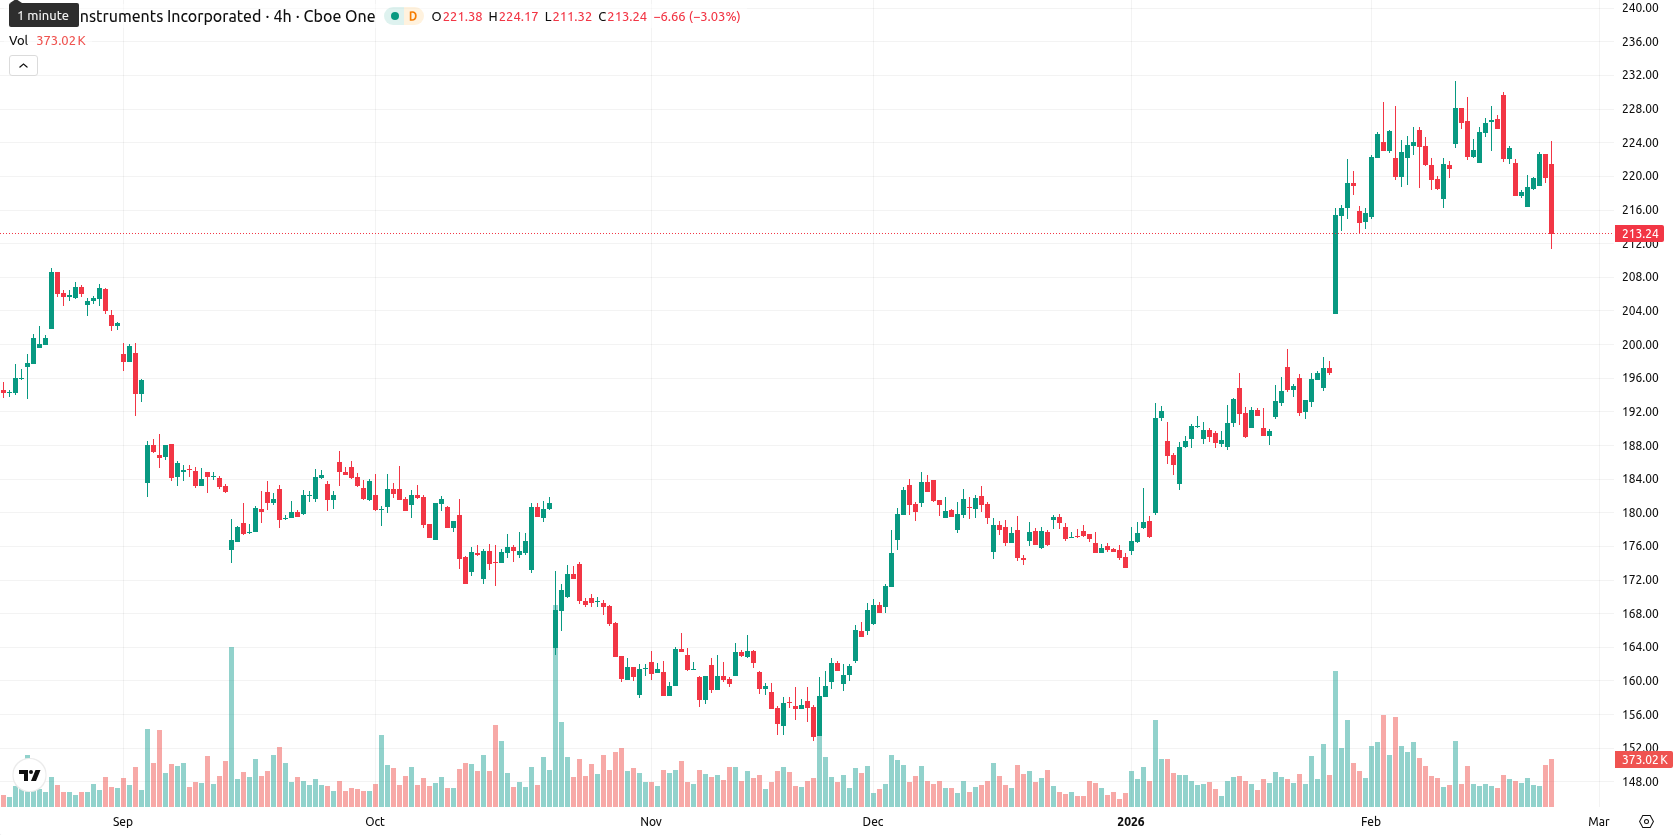
Texas Instruments Incorporated (TXN) is trading at $212.14, currently below its MA-20 at $219.22 but well above both the MA-50 at $197.59 and MA-200 at $188.79. This setup suggests short-term pressure from sellers, while medium- and long-term trends remain bullish with strong underlying support. The Ichimoku Kijun level stands at $209.64, which now serves as immediate support below the current price.
Highlights
- Texas Instruments announced a $7.5 billion acquisition of Silicon Laboratories on February 4, targeting $450 million in annual cost savings within three years.
- Institutional activity shows Kovitz Investment Group Partners LLC reduced holdings, while Hillsdale Investment Management Inc. and Greenland Capital Management LP increased positions in Texas Instruments.
- TXN trades at $212.14, with strong medium- and long-term support (MA-50 at $197.59, MA-200 at $188.79), expected to consolidate between $209.64–$223.00 in the coming week.
Record acquisition and shifting institutional stakes drive strategy focus
On February 4, Texas Instruments announced a $7.5 billion agreement to acquire Silicon Laboratories, representing its largest purchase since 2011 and targeting $450 million in annual cost savings over three years through enhanced manufacturing and operational efficiency. Recent institutional activity includes a notable reduction in holdings by Kovitz Investment Group Partners LLC, while Hillsdale Investment Management Inc. initiated a new position and Greenland Capital Management LP significantly increased its stake. These developments highlight ongoing corporate strategy and increased institutional engagement.
Momentum signals diverge as buyers lose control after volatile pullback
Momentum indicators present a mixed picture. The MACD on D1 signals strong upward momentum, echoed by a robust ADX, yet the Stochastic RSI shows an oversold condition while the RSI remains constructive and the CCI is neutral. Bull/Bear Power on D1 is classified as overbought, indicating that buyers recently dominated but have now lost traction intraday. The Awesome Oscillator is neutral and does not reinforce either side. TXN opened at $221.49, showing a modest gap up from the previous close of $219.58, but rapidly lost ground with a 3.39% drop to $212.14, finishing near the low of today’s range ($213.64 – $224.11), highlighting high volatility and selling pressure after the open. Daily momentum signals and intraday performance are at odds, as underlying trend strength is contradicted by today's aggressive pullback.
Upside scenario likely as technical buy signals outweigh downside risk
For the coming week, the expected trading range for TXN is $207.00 to $223.00, normalized around current price to reflect typical blue-chip volatility. With three of four key weekly indicators (RSI, MACD, and MA-50) signaling "Buy," the probability of price increase over the next five sessions is high (more than 80%), while the chance of a decline is very low. The baseline scenario is for TXN to consolidate between immediate support ($209.64 – $212.00) and resistance near $220.00 – $223.00. A bullish move would require a breakout above $223.00, opening room for a recovery toward the upper end of the expected range, while a break below support at $209.64 may trigger additional weakness, with provisional downside limited near $207.00.
Previously it was reported that Texas Instruments is exhibiting a bullish structure, trading above key moving averages with constructive momentum indicators such as MACD and ADX, while maintaining firm institutional support despite recent insider selling. The stock is facing near-term resistance and some intraday selling pressure, as oscillators signal possible overbought conditions, suggesting potential for short-term consolidation before further advances.


Latest Texas Instruments News


-
 Afghanistan
-
 Albania
-
 Algeria
-
 Angola
-
 Argentina
-
 Armenia
-
 Australia
-
 Austria
-
 Azerbaijan
-
 Bahamas
-
 Bahrain
-
 Bangladesh
-
 Belarus
-
 Belgium
-
 Bolivia
-
 Botswana
-
 Brazil
-
 Brunei
-
 Bulgaria
-
 Cambodia
-
 Cameroon
-
 Canada
-
 Chile
Chile
-
 China
China
-
 Colombia
-
 Congo
Congo
-
 Costa Rica
-
 Cote d'Ivoire
-
 Croatia
-
 Cuba
Cuba
-
 Cyprus
-
 Czechia
-
 DR Congo
-
 Denmark
-
 Dominican Republic
-
 Ecuador
-
 Egypt
Egypt
-
 El Salvador
-
 Estonia
-
 Eswatini
-
 Ethiopia
-
 Finland
-
 France
-
 Georgia
-
 Germany
-
 Ghana
Ghana
-
 Greece
-
 Haiti
Haiti
-
 Hong Kong
-
 Hungary
-
 India
India
-
 Indonesia
-
 Iran, Islamic republic
-
 Iraq
Iraq
-
 Ireland
-
 Israel
-
 Italy
Italy
-
 Jamaica
-
 Japan
Japan
-
 Jordan
-
 Kazakhstan
-
 Kenya
Kenya
-
 Korea
Korea
-
 Kuwait
-
 Kyrgyzstan
-
 Laos
Laos
-
 Latvia
-
 Lebanon
-
 Lesotho
-
 Libya
Libya
-
 Lithuania
-
 Luxembourg
-
 Madagascar
-
 Malaysia
-
 Malta
Malta
-
 Mauritius
-
 Mexico
-
 Moldova
-
 Mongolia
-
 Montenegro
-
 Morocco
-
 Mozambique
-
 Myanmar
-
 Namibia
-
 Nepal
Nepal
-
 Netherlands
-
 New Zealand
-
 Nigeria
-
 North Macedonia
-
 Norway
-
 Oman
Oman
-
 Pakistan
-
 Palestine
-
 Panama
-
 Papua New Guinea
-
 Paraguay
-
 Peru
Peru
-
 Philippines
-
 Poland
-
 Portugal
-
 Puerto Rico
-
 Qatar
Qatar
-
 Reunion
-
 Romania
-
 Rwanda
-
 Saudi Arabia
-
 Serbia
-
 Singapore
-
 Slovakia
-
 Slovenia
-
 Somalia
-
 South Africa
-
 Spain
Spain
-
 Sri Lanka
-
 Sweden
-
 Switzerland
-
 Syria
Syria
-
 Taiwan
-
 Tajikistan
-
 Tanzania
-
 Thailand
-
 Trinidad and Tobago
-
 Tunisia
-
 Turkey
-
 UAE
UAE
-
 Uganda
-
 Ukraine
-
 United Kingdom
-
United States
-
 Uruguay
-
 Uzbekistan
-
 Venezuela
-
 Vietnam
-
 Yemen
Yemen
-
 Zambia
-
 Zimbabwe
- Forex
- Crypto
