
CleanSpark stock price forecast: Revenue miss caps outlook as CLSK drops 3.10% to $10.13

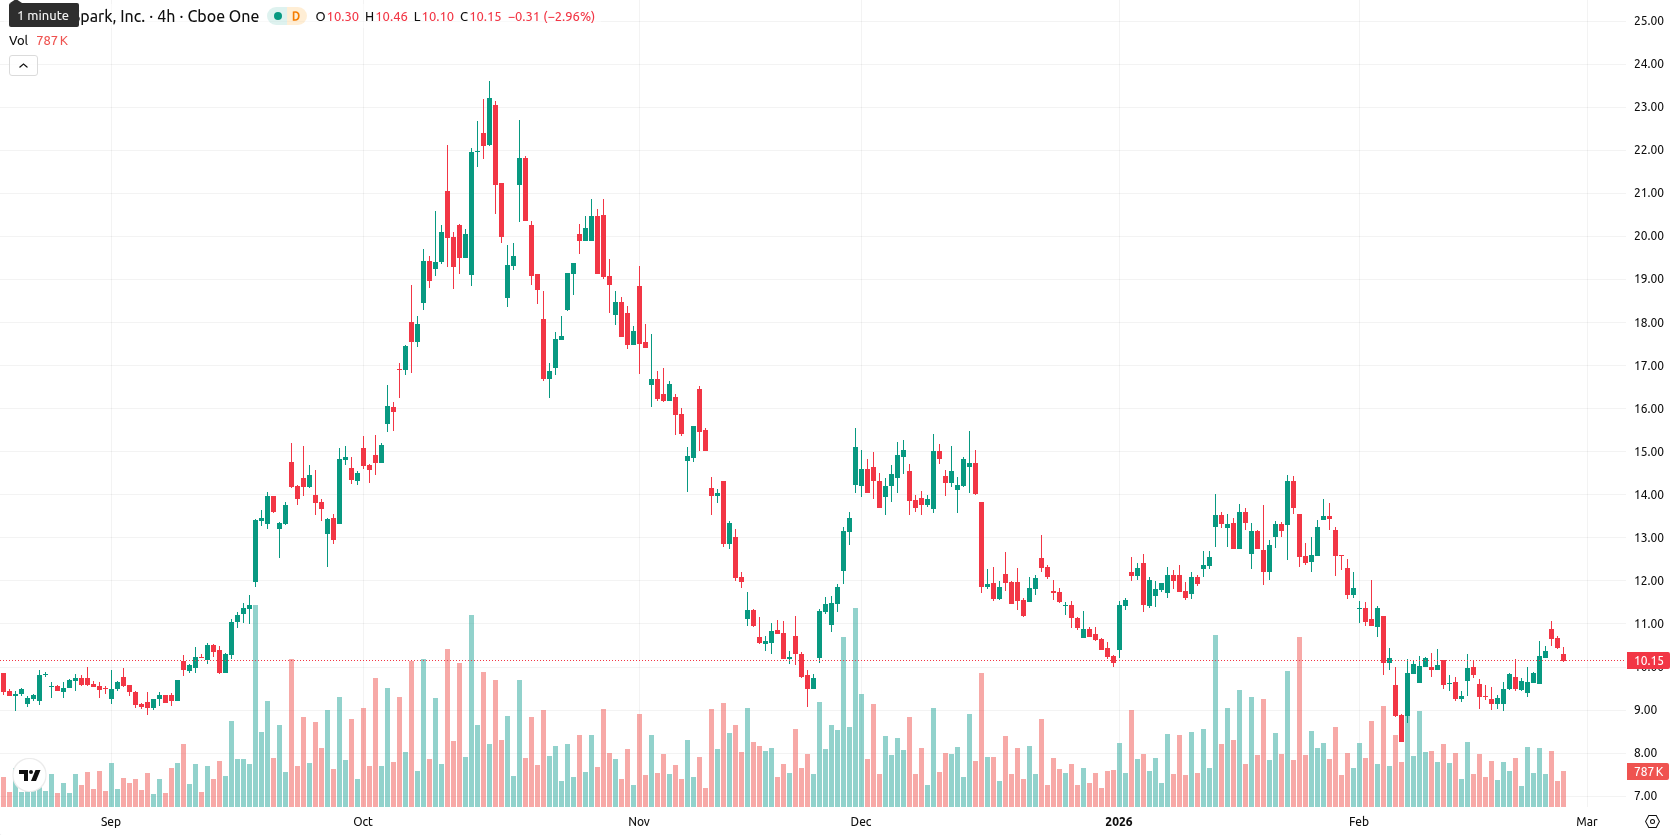
CleanSpark, Inc. (CLSK) is trading at $10.13, just below the MA-20 ($10.32), well beneath the MA-50 ($11.39), and considerably under the MA-200 ($12.19). This setup indicates ongoing short- and medium-term selling pressure, with the long-term trend remaining bearish; the Ichimoku Kijun on D1 at $11.35 highlights immediate resistance above the current level.
Highlights
- CleanSpark reported Q1 2026 revenue of $181.2 million, up 11.6% year-over-year but missing analyst expectations of $194 million.
- The company is pivoting toward high-performance computing and AI infrastructure, leveraging its sustainable energy assets amid rising industry demand.
- CLSK trades at $10.13, below key moving averages (MA-20: $10.32; MA-50: $11.39; MA-200: $12.19), with strong selling pressure and immediate resistance at $11.35.
Elevated trading volume follows revenue miss and strategic pivot
CleanSpark reported its fiscal first-quarter 2026 results on February 5, 2026, posting revenue of $181.2 million, which marked an 11.6% year-over-year increase but came in below analyst expectations of about $194 million. The company is pursuing a strategic shift toward high-performance computing and AI infrastructure, seeking to capitalize on rising demand for compute power using its sustainable energy facilities. Trading volume was notably high following the announcement, and pre-market trading activity reflected continued interest, though price action has remained under broader selling pressure.
Mixed momentum signals as oscillators warn of short-term risk
On the daily chart, momentum indicators present mixed signals: MACD shows a strong sell, while ADX is neutral, indicating weak trend strength. RSI remains in neutral, leaning bearish, with both Stochastic RSI and Bull/Bear Power suggesting overbought conditions and recent buyer engagement. The Awesome Oscillator is neutral, providing no confirmation of the prevailing trend. After opening nearly flat, CLSK slipped 3.10% today, settling near the day's low within a moderate range, reflecting renewed post-open weakness; divergent oscillators point to short-term risk if profit-taking intensifies.
Sideways bias prevails as downside risk overshadows upside scenario
Over the next five trading days, CLSK is expected to move within a $9.65 – $10.80 price range, corresponding to a typical volatility band relative to current levels. The likelihood of upward movement is low (less than 20%), and downside risk prevails. Most probable is sideways action within this band, reflecting both indecision and moderate volatility. A bullish scenario requires a breakout above $11.35, while a move below $9.65 would indicate increased selling pressure.
Previously it was reported that CleanSpark Inc. trades below key moving averages and remains under short- and longer-term selling pressure, with dynamic support at the MA-20 and resistance at the MA-50 and Ichimoku Kijun. Momentum indicators such as MACD, RSI, and oscillators reflect weak bearish conviction and mixed momentum, as volatility persists and price action hovers near session lows.


Latest CleanSpark News


-
 Afghanistan
-
 Albania
-
 Algeria
-
 Angola
-
 Argentina
-
 Armenia
-
 Australia
-
 Austria
-
 Azerbaijan
-
 Bahamas
-
 Bahrain
-
 Bangladesh
-
 Belarus
-
 Belgium
-
 Bolivia
-
 Botswana
-
 Brazil
-
 Brunei
-
 Bulgaria
-
 Cambodia
-
 Cameroon
-
 Canada
-
 Chile
Chile
-
 China
China
-
 Colombia
-
 Congo
Congo
-
 Costa Rica
-
 Cote d'Ivoire
-
 Croatia
-
 Cuba
Cuba
-
 Cyprus
-
 Czechia
-
 DR Congo
-
 Denmark
-
 Dominican Republic
-
 Ecuador
-
 Egypt
Egypt
-
 El Salvador
-
 Estonia
-
 Eswatini
-
 Ethiopia
-
 Finland
-
 France
-
 Georgia
-
 Germany
-
 Ghana
Ghana
-
 Greece
-
 Haiti
Haiti
-
 Hong Kong
-
 Hungary
-
 India
India
-
 Indonesia
-
 Iran, Islamic republic
-
 Iraq
Iraq
-
 Ireland
-
 Israel
-
 Italy
Italy
-
 Jamaica
-
 Japan
Japan
-
 Jordan
-
 Kazakhstan
-
 Kenya
Kenya
-
 Korea
Korea
-
 Kuwait
-
 Kyrgyzstan
-
 Laos
Laos
-
 Latvia
-
 Lebanon
-
 Lesotho
-
 Libya
Libya
-
 Lithuania
-
 Luxembourg
-
 Madagascar
-
 Malaysia
-
 Malta
Malta
-
 Mauritius
-
 Mexico
-
 Moldova
-
 Mongolia
-
 Montenegro
-
 Morocco
-
 Mozambique
-
 Myanmar
-
 Namibia
-
 Nepal
Nepal
-
 Netherlands
-
 New Zealand
-
 Nigeria
-
 North Macedonia
-
 Norway
-
 Oman
Oman
-
 Pakistan
-
 Palestine
-
 Panama
-
 Papua New Guinea
-
 Paraguay
-
 Peru
Peru
-
 Philippines
-
 Poland
-
 Portugal
-
 Puerto Rico
-
 Qatar
Qatar
-
 Reunion
-
 Romania
-
 Rwanda
-
 Saudi Arabia
-
 Serbia
-
 Singapore
-
 Slovakia
-
 Slovenia
-
 Somalia
-
 South Africa
-
 Spain
Spain
-
 Sri Lanka
-
 Sweden
-
 Switzerland
-
 Syria
Syria
-
 Taiwan
-
 Tajikistan
-
 Tanzania
-
 Thailand
-
 Trinidad and Tobago
-
 Tunisia
-
 Turkey
-
 UAE
UAE
-
 Uganda
-
 Ukraine
-
 United Kingdom
-
United States
-
 Uruguay
-
 Uzbekistan
-
 Venezuela
-
 Vietnam
-
 Yemen
Yemen
-
 Zambia
-
 Zimbabwe
- Forex
- Crypto
