
AI hardware shift and technical weakness — Meta stock drops 1.33%

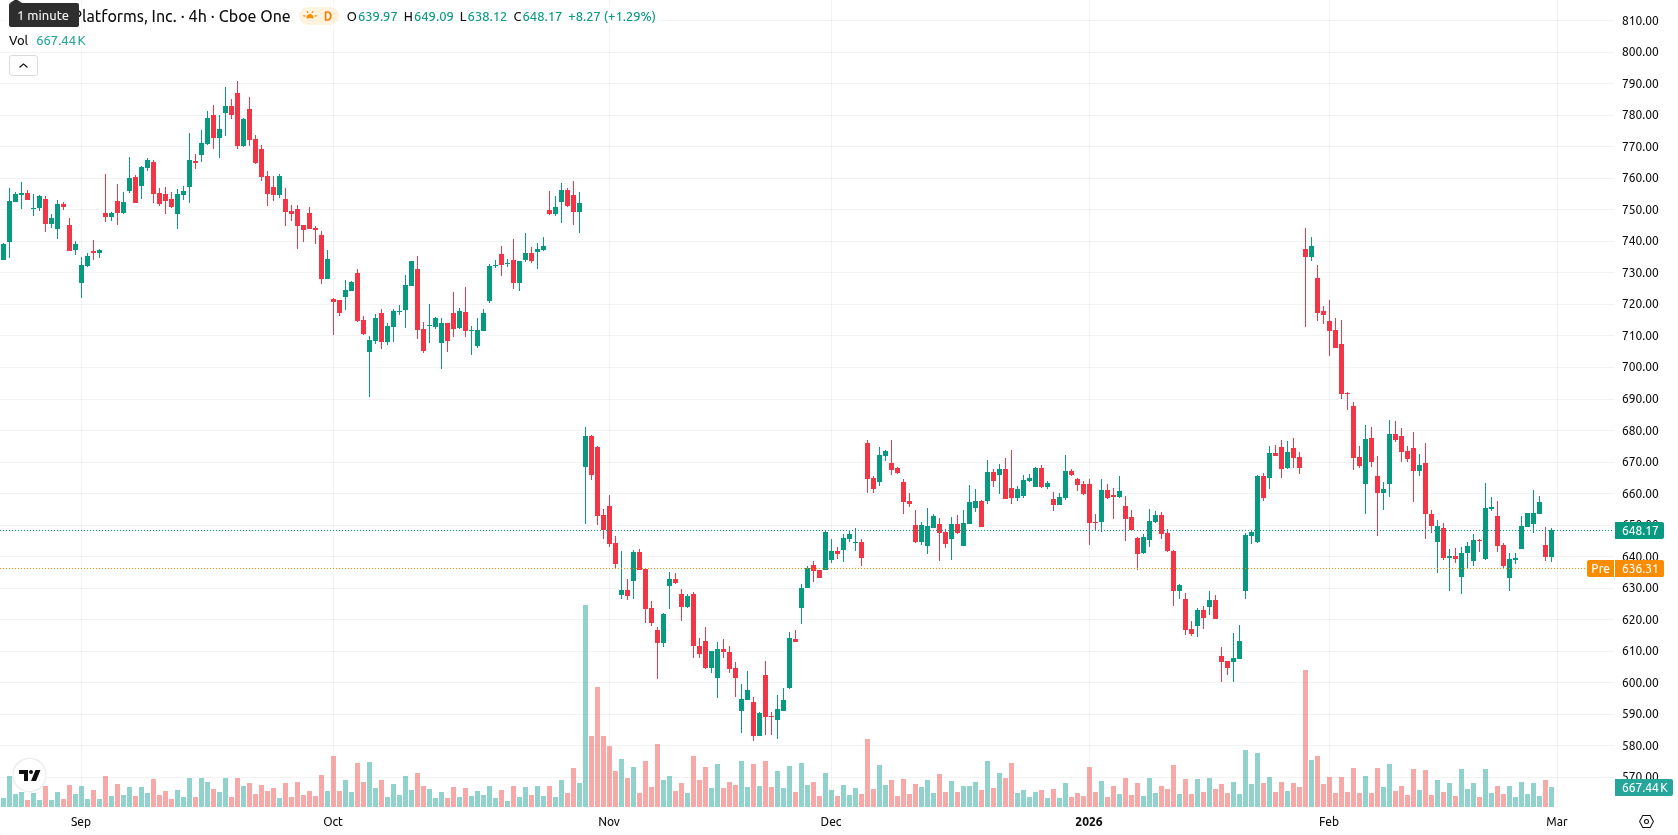
Meta Platforms, Inc. (META, formerly Facebook, Inc.) is trading at $648.28, down 1.33% for the day. The price sits below the MA-20 ($662.00), MA-50 ($656.74), and well under the MA-200 ($691.30), which points to continued downward pressure across short, medium, and long timeframes.
Highlights
- Meta finalized a $60 billion AI chip sale and converted the deal into a long-term equity stake in Advanced Micro Devices, deepening its AI hardware strategy.
- This investment marks a strategic shift for Meta, directly aligning it with AMD for AI development despite ongoing selling pressure on its shares.
- META trades at $648.28, below key moving averages (MA-20 $662.00, MA-50 $656.74, MA-200 $691.30), with bearish momentum and a likely short-term range of $630–$665.
AI hardware strategy shifts as Meta invests via AMD equity stake
Meta completed a $60 billion sale of AI chips and converted the transaction into a long-term equity stake in Advanced Micro Devices, adjusting its artificial intelligence strategy. This shift marks a direct strategic investment by Meta in AI hardware and partnership development. The new arrangement was established as part of the company’s corporate activities, though price action has remained under broader selling pressure.
Bearish momentum persists as technical indicators favor sellers
Technical signals for META remain bearish. Prices are below all key moving averages, with the Ichimoku Kijun at $685.28 acting as the nearest resistance. Momentum indicators favor sellers: MACD shows a persistent sell bias on both daily and weekly timeframes, and ADX values (10.58 daily, 13.44 weekly) confirm a weak, undecisive trend. RSI and Commodity Channel Index are below neutral and show sell signals, while Stochastic RSI points to mild oversold conditions. Bull/Bear Power demonstrates intraday seller dominance. The session opened with a downside gap from $657.01 to $644.35, and while the latest price is near the session high, the overall tone remains negative despite a minor bounce off the lows.
Further declines likely as upside probability remains subdued
For the coming week, the expected price band is $630 to $665, reflecting a typical volatility range relative to current levels. The probability of an upward move is very low (less than 20%), so further declines are more likely. The baseline outlook is for consolidation between $630 and $665, with a bullish breakout above $665 requiring a reversal in momentum and a test of immediate resistance. A breakdown below $630 could accelerate declines toward additional support levels defined by the moving averages, keeping the technical forecast defensive unless sentiment shifts.
Last time, analysts noted that Meta Platforms Inc. was experiencing sustained bearish momentum, with the stock trading below its 20-, 50-, and 200-day moving averages, signaling persistent short- to mid-term selling pressure while long-term support held higher. Technical indicators including MACD and ADX reflected weak momentum and a lack of clear trend, with nearby resistance near the MA-50 and dynamic resistance identified by Ichimoku, as sellers continued to dominate despite mixed signals from short-term oscillators.


Latest META News


-
 Afghanistan
-
 Albania
-
 Algeria
-
 Angola
-
 Argentina
-
 Armenia
-
 Australia
-
 Austria
-
 Azerbaijan
-
 Bahamas
-
 Bahrain
-
 Bangladesh
-
 Belarus
-
 Belgium
-
 Bolivia
-
 Botswana
-
 Brazil
-
 Brunei
-
 Bulgaria
-
 Cambodia
-
 Cameroon
-
 Canada
-
 Chile
Chile
-
 China
China
-
 Colombia
-
 Congo
Congo
-
 Costa Rica
-
 Cote d'Ivoire
-
 Croatia
-
 Cuba
Cuba
-
 Cyprus
-
 Czechia
-
 DR Congo
-
 Denmark
-
 Dominican Republic
-
 Ecuador
-
 Egypt
Egypt
-
 El Salvador
-
 Estonia
-
 Eswatini
-
 Ethiopia
-
 Finland
-
 France
-
 Georgia
-
 Germany
-
 Ghana
Ghana
-
 Greece
-
 Haiti
Haiti
-
 Hong Kong
-
 Hungary
-
 India
India
-
 Indonesia
-
 Iran, Islamic republic
-
 Iraq
Iraq
-
 Ireland
-
 Israel
-
 Italy
Italy
-
 Jamaica
-
 Japan
Japan
-
 Jordan
-
 Kazakhstan
-
 Kenya
Kenya
-
 Korea
Korea
-
 Kuwait
-
 Kyrgyzstan
-
 Laos
Laos
-
 Latvia
-
 Lebanon
-
 Lesotho
-
 Libya
Libya
-
 Lithuania
-
 Luxembourg
-
 Madagascar
-
 Malaysia
-
 Malta
Malta
-
 Mauritius
-
 Mexico
-
 Moldova
-
 Mongolia
-
 Montenegro
-
 Morocco
-
 Mozambique
-
 Myanmar
-
 Namibia
-
 Nepal
Nepal
-
 Netherlands
-
 New Zealand
-
 Nigeria
-
 North Macedonia
-
 Norway
-
 Oman
Oman
-
 Pakistan
-
 Palestine
-
 Panama
-
 Papua New Guinea
-
 Paraguay
-
 Peru
Peru
-
 Philippines
-
 Poland
-
 Portugal
-
 Puerto Rico
-
 Qatar
Qatar
-
 Reunion
-
 Romania
-
 Rwanda
-
 Saudi Arabia
-
 Serbia
-
 Singapore
-
 Slovakia
-
 Slovenia
-
 Somalia
-
 South Africa
-
 Spain
Spain
-
 Sri Lanka
-
 Sweden
-
 Switzerland
-
 Syria
Syria
-
 Taiwan
-
 Tajikistan
-
 Tanzania
-
 Thailand
-
 Trinidad and Tobago
-
 Tunisia
-
 Turkey
-
 UAE
UAE
-
 Uganda
-
 Ukraine
-
 United Kingdom
-
United States
-
 Uruguay
-
 Uzbekistan
-
 Venezuela
-
 Vietnam
-
 Yemen
Yemen
-
 Zambia
-
 Zimbabwe
- Forex
- Crypto
