
+1.33% for Microsoft stock — AI optimism and earnings drive moderate upside

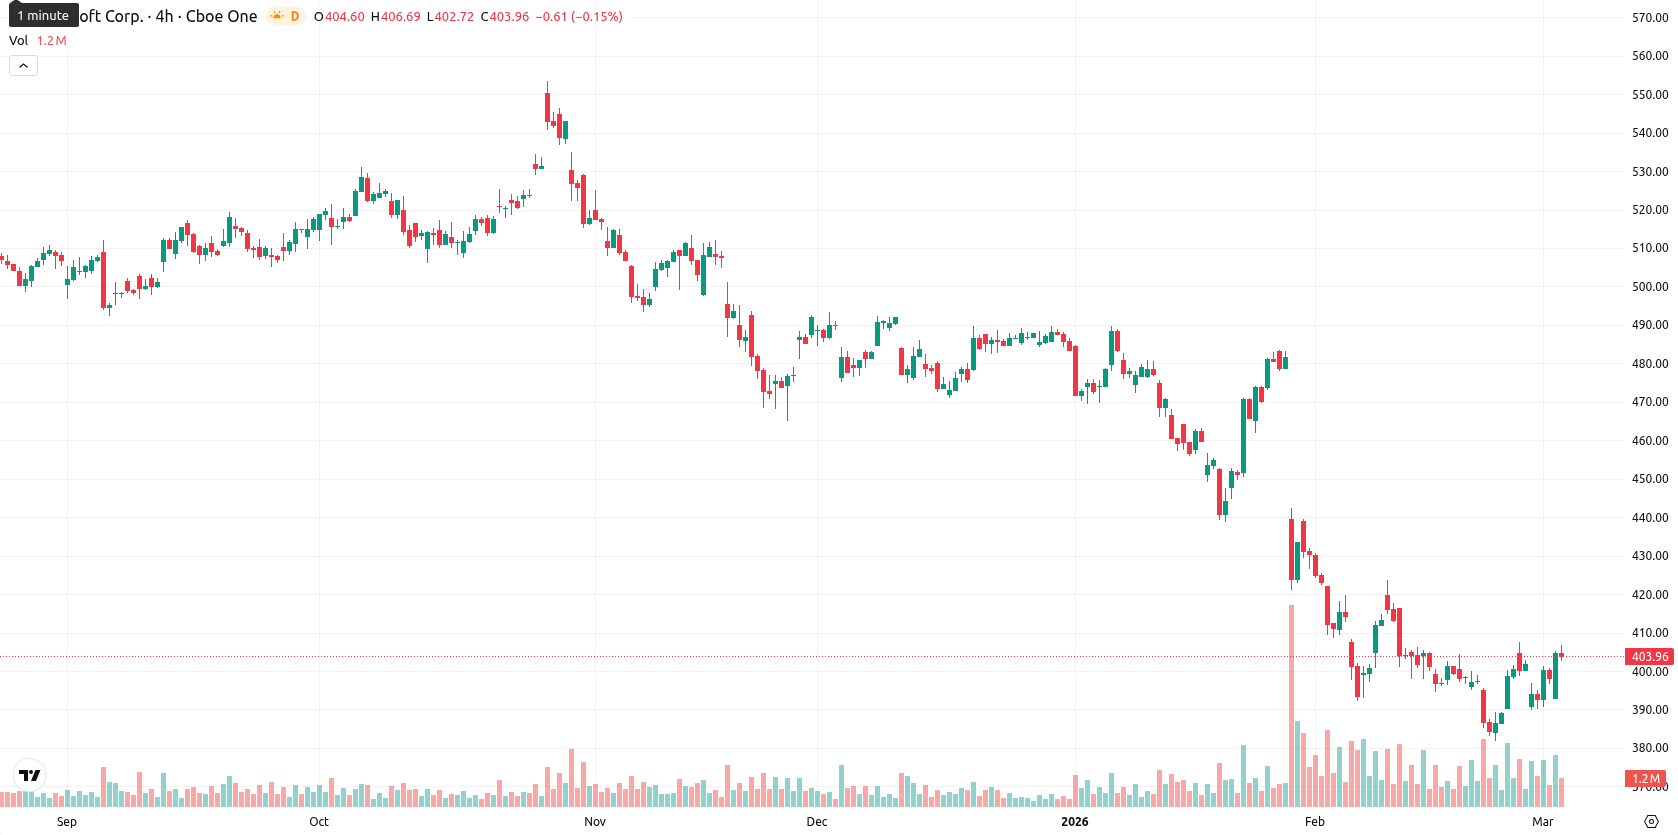
Microsoft Corporation (MSFT) is trading at $403.87, having gained 1.33% today. The price is slightly above its MA-20 ($400.90) but remains below the MA-50 ($442.34) and MA-200 ($485.25), reflecting mild short-term strength yet ongoing medium- and long-term downward pressure.
Highlights
- Microsoft posted robust Q2 results with revenue up 17% to $81.3 billion, driven by strong cloud and AI demand.
- Ongoing FTC review of OpenAI partnership obligations adds governance risk and regulatory overhang to Microsoft's outlook.
- Shares remain pressured below major resistance, with technical signals favoring a likely rangebound move between $385 and $420 near term.
Strong cloud-driven results as FTC probes OpenAI partnership risks
Microsoft reported strong fiscal second-quarter financial results, with revenue increasing 17% year-over-year to $81.3 billion, operating income rising 21% to $38.3 billion, and earnings per share up 24% to $4.14. Growth continues to be driven by robust demand for cloud and AI services, including new Copilot AI deployments and expanded data center capacity targeted at AI workloads and Azure revenue. Investors and regulators are monitoring the company's large commercial obligation tied to its OpenAI partnership, which is currently under FTC review and has sparked governance-related tensions.
Overbought signals diverge from bearish trend as resistance holds
The current price is trading modestly above its MA-20 while remaining well below the MA-50 and MA-200, underscoring only minor short-term momentum but persistent broader downside pressure. The D1 Ichimoku Kijun level at $432.73 stands as immediate resistance, with daily indicators showing mixed momentum: ADX (30.49) and MACD both signal Sell/Strong Sell, while the RSI is neutral near 43.96. The Stochastic RSI and Bull/Bear Power indicate overbought conditions, highlighting short-term buyer activity, yet overall trend signals remain negative. Today’s bounce, occurring in the upper half of the $392.71–$406.58 range, reveals moderate volatility and a divergence between overbought oscillators and bearish trend indicators.
Rangebound outlook as downside momentum curbs rally prospects
Over the next five trading days, MSFT is likely to fluctuate within a $385–$420 band, reflecting typical volatility at current levels. The probability of a sustained rally is low (less than 20%), with a pullback favored by prevailing trend momentum. Baseline outlook is for rangebound trading as uncertainty persists. A break above the $432.73 Kijun resistance may trigger short covering, while renewed selling could push the price below $385.
Previously it was reported that Microsoft remained under sustained selling pressure, trading below key moving averages with technical indicators such as MACD and RSI reflecting bearish momentum and limited rebound strength. The stock faces immediate resistance at the Ichimoku Kijun and risks further downside amid regulatory scrutiny and heightened industry competition, with intraday volatility favoring sideways action within a defined range.


Latest Microsoft News


-
 Afghanistan
-
 Albania
-
 Algeria
-
 Angola
-
 Argentina
-
 Armenia
-
 Australia
-
 Austria
-
 Azerbaijan
-
 Bahamas
-
 Bahrain
-
 Bangladesh
-
 Belarus
-
 Belgium
-
 Bolivia
-
 Botswana
-
 Brazil
-
 Brunei
-
 Bulgaria
-
 Cambodia
-
 Cameroon
-
 Canada
-
 Chile
Chile
-
 China
China
-
 Colombia
-
 Congo
Congo
-
 Costa Rica
-
 Cote d'Ivoire
-
 Croatia
-
 Cuba
Cuba
-
 Cyprus
-
 Czechia
-
 DR Congo
-
 Denmark
-
 Dominican Republic
-
 Ecuador
-
 Egypt
Egypt
-
 El Salvador
-
 Estonia
-
 Eswatini
-
 Ethiopia
-
 Finland
-
 France
-
 Georgia
-
 Germany
-
 Ghana
Ghana
-
 Greece
-
 Haiti
Haiti
-
 Hong Kong
-
 Hungary
-
 India
India
-
 Indonesia
-
 Iran, Islamic republic
-
 Iraq
Iraq
-
 Ireland
-
 Israel
-
 Italy
Italy
-
 Jamaica
-
 Japan
Japan
-
 Jordan
-
 Kazakhstan
-
 Kenya
Kenya
-
 Korea
Korea
-
 Kuwait
-
 Kyrgyzstan
-
 Laos
Laos
-
 Latvia
-
 Lebanon
-
 Lesotho
-
 Libya
Libya
-
 Lithuania
-
 Luxembourg
-
 Madagascar
-
 Malaysia
-
 Malta
Malta
-
 Mauritius
-
 Mexico
-
 Moldova
-
 Mongolia
-
 Montenegro
-
 Morocco
-
 Mozambique
-
 Myanmar
-
 Namibia
-
 Nepal
Nepal
-
 Netherlands
-
 New Zealand
-
 Nigeria
-
 North Macedonia
-
 Norway
-
 Oman
Oman
-
 Pakistan
-
 Palestine
-
 Panama
-
 Papua New Guinea
-
 Paraguay
-
 Peru
Peru
-
 Philippines
-
 Poland
-
 Portugal
-
 Puerto Rico
-
 Qatar
Qatar
-
 Reunion
-
 Romania
-
 Rwanda
-
 Saudi Arabia
-
 Serbia
-
 Singapore
-
 Slovakia
-
 Slovenia
-
 Somalia
-
 South Africa
-
 Spain
Spain
-
 Sri Lanka
-
 Sweden
-
 Switzerland
-
 Syria
Syria
-
 Taiwan
-
 Tajikistan
-
 Tanzania
-
 Thailand
-
 Trinidad and Tobago
-
 Tunisia
-
 Turkey
-
 UAE
UAE
-
 Uganda
-
 Ukraine
-
 United Kingdom
-
United States
-
 Uruguay
-
 Uzbekistan
-
 Venezuela
-
 Vietnam
-
 Yemen
Yemen
-
 Zambia
-
 Zimbabwe
- Forex
- Crypto
