
Affirm stock: Mixed indicators and new partnerships support a 3.14% advance

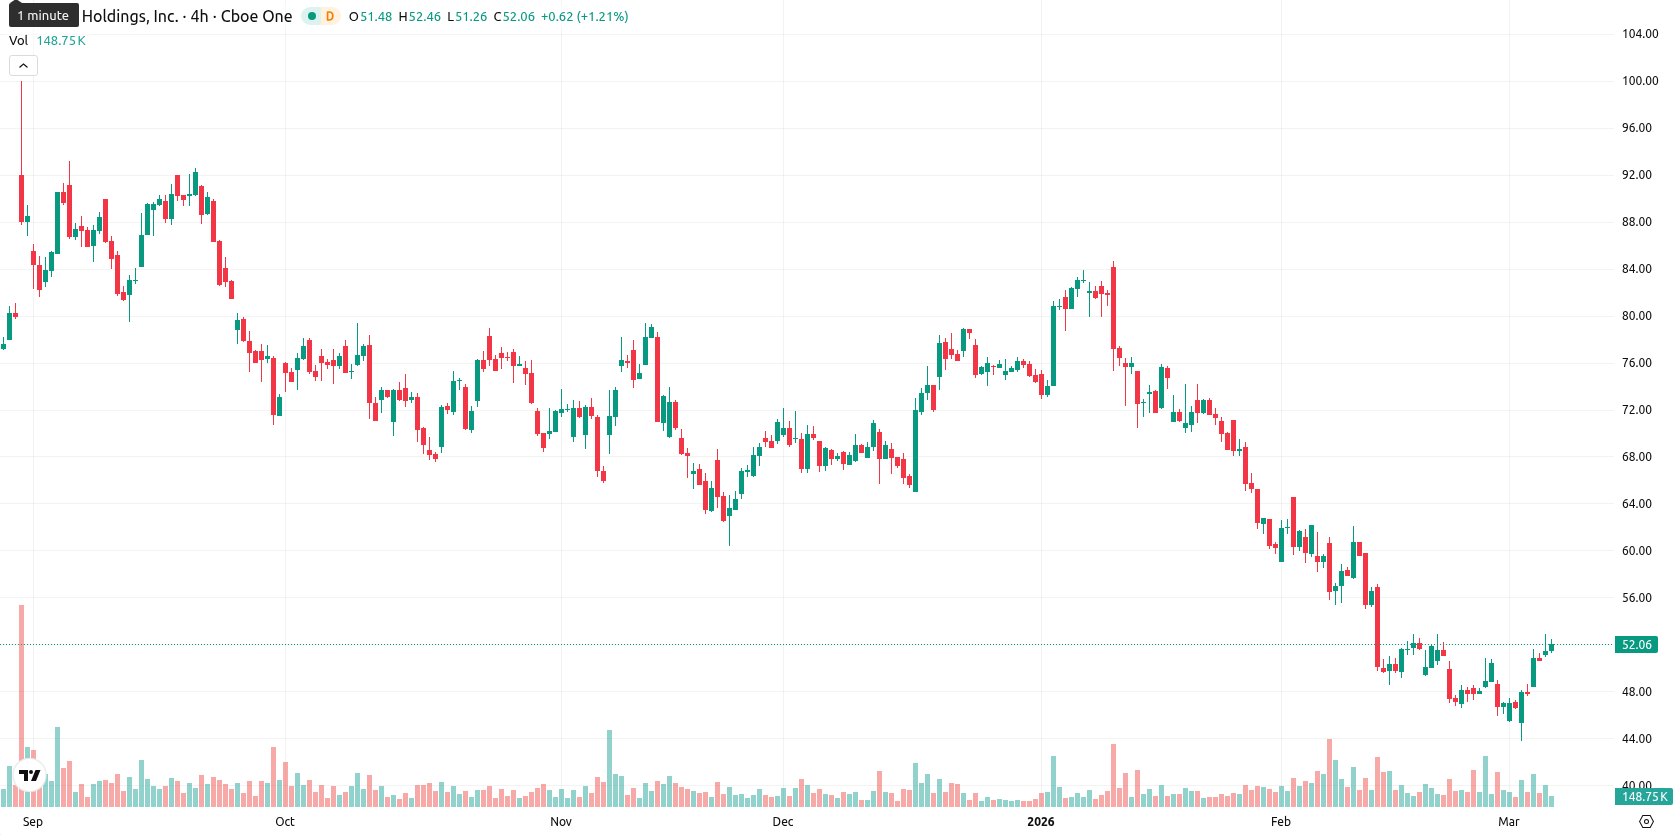
Affirm Holdings, Inc. (AFRM) is trading at $52.32, up 3.14% for the day, sitting just above its MA-20 ($52.21) but remaining well below the MA-50 ($64.88) and MA-200 ($69.22). This signals short-term strength for Affirm, although longer-term technical pressure persists, with immediate resistance at the Ichimoku Kijun level of $57.44.
Highlights
- Affirm expanded its Stripe partnership to embed pay-over-time options in AI-driven shared payment solutions, targeting AI commerce growth.
- Affirm outperformed recent earnings and revenue expectations, reinforcing its strategy focus shared at the Morgan Stanley TMT Conference.
- Technicals indicate intraday bullishness within a $47.50–$54.50 range, but mixed momentum and resistance warn of downside risk prevailing.
Growth initiatives and partnerships as strategy drives optimistic sentiment
On March 3, 2026, Affirm presented at the Morgan Stanley Technology, Media & Telecom Conference, where the company's strategy, growth, and new product initiatives were discussed. Earlier in the month, Affirm expanded its partnership with Stripe, integrating pay-over-time options into Stripe's Shared Payment Tokens to support AI-powered commerce and BNPL transactions via AI agents. These developments follow Affirm exceeding recent earnings and revenue expectations.
Mixed momentum and overbought signals as buyers test session highs
Momentum signals for AFRM are currently mixed. The daily MACD points to a strong sell and the ADX continues to indicate bearish control, even though shorter timeframes show some buying pressure. The RSI remains subdued and suggests room for further downside, while Stochastic RSI and Bull/Bear Power highlight overbought intraday conditions and the dominance of buyers within the session. The price opened with a modest positive gap (from $50.72 to $51.13) and is trading near today's range highs ($51.11–$52.71), with moderate intraday volatility supporting the push to session tops. Diverging oscillators and momentum indicators, however, raise caution about potential exhaustion.
Downside bias as volatility and resistance constrain breakout prospects
Over the next five trading days, AFRM is likely to fluctuate within a volatility band of $47.50 to $54.50, reflecting recent heightened volatility — a corridor of approximately ±12% from current levels. There is a low probability (less than 20%) of a sustained price increase, making further downside more likely in the short term. The base scenario is sideways movement between $47.50 and $54.50. A decisive close above $57.44 could lead to a test of the $60.00 region, while a drop below $47.50 would put the $45.00 area in focus.
Previously it was reported that Affirm Holdings, Inc. is experiencing short-term bullish momentum as it trades just above its MA-20, though the price remains below longer-term moving averages, indicating persistent medium- and long-term resistance. Mixed technical signals, including a weak RSI, bearish MACD, and overbought oscillators, suggest that while dynamic support is present near current levels, resistance at $57.44 limits further upside without a decisive breakout.


Latest Affirm News


-
 Afghanistan
-
 Albania
-
 Algeria
-
 Angola
-
 Argentina
-
 Armenia
-
 Australia
-
 Austria
-
 Azerbaijan
-
 Bahamas
-
 Bahrain
-
 Bangladesh
-
 Belarus
-
 Belgium
-
 Bolivia
-
 Botswana
-
 Brazil
-
 Brunei
-
 Bulgaria
-
 Cambodia
-
 Cameroon
-
 Canada
-
 Chile
Chile
-
 China
China
-
 Colombia
-
 Congo
Congo
-
 Costa Rica
-
 Cote d'Ivoire
-
 Croatia
-
 Cuba
Cuba
-
 Cyprus
-
 Czechia
-
 DR Congo
-
 Denmark
-
 Dominican Republic
-
 Ecuador
-
 Egypt
Egypt
-
 El Salvador
-
 Estonia
-
 Eswatini
-
 Ethiopia
-
 Finland
-
 France
-
 Georgia
-
 Germany
-
 Ghana
Ghana
-
 Greece
-
 Haiti
Haiti
-
 Hong Kong
-
 Hungary
-
 India
India
-
 Indonesia
-
 Iran, Islamic republic
-
 Iraq
Iraq
-
 Ireland
-
 Israel
-
 Italy
Italy
-
 Jamaica
-
 Japan
Japan
-
 Jordan
-
 Kazakhstan
-
 Kenya
Kenya
-
 Korea
Korea
-
 Kuwait
-
 Kyrgyzstan
-
 Laos
Laos
-
 Latvia
-
 Lebanon
-
 Lesotho
-
 Libya
Libya
-
 Lithuania
-
 Luxembourg
-
 Madagascar
-
 Malaysia
-
 Malta
Malta
-
 Mauritius
-
 Mexico
-
 Moldova
-
 Mongolia
-
 Montenegro
-
 Morocco
-
 Mozambique
-
 Myanmar
-
 Namibia
-
 Nepal
Nepal
-
 Netherlands
-
 New Zealand
-
 Nigeria
-
 North Macedonia
-
 Norway
-
 Oman
Oman
-
 Pakistan
-
 Palestine
-
 Panama
-
 Papua New Guinea
-
 Paraguay
-
 Peru
Peru
-
 Philippines
-
 Poland
-
 Portugal
-
 Puerto Rico
-
 Qatar
Qatar
-
 Reunion
-
 Romania
-
 Rwanda
-
 Saudi Arabia
-
 Serbia
-
 Singapore
-
 Slovakia
-
 Slovenia
-
 Somalia
-
 South Africa
-
 Spain
Spain
-
 Sri Lanka
-
 Sweden
-
 Switzerland
-
 Syria
Syria
-
 Taiwan
-
 Tajikistan
-
 Tanzania
-
 Thailand
-
 Trinidad and Tobago
-
 Tunisia
-
 Turkey
-
 UAE
UAE
-
 Uganda
-
 Ukraine
-
 United Kingdom
-
United States
-
 Uruguay
-
 Uzbekistan
-
 Venezuela
-
 Vietnam
-
 Yemen
Yemen
-
 Zambia
-
 Zimbabwe
- Forex
- Crypto
