
Canopy Growth stock price forecast: Bearish momentum persists as CGC slips 3.27%

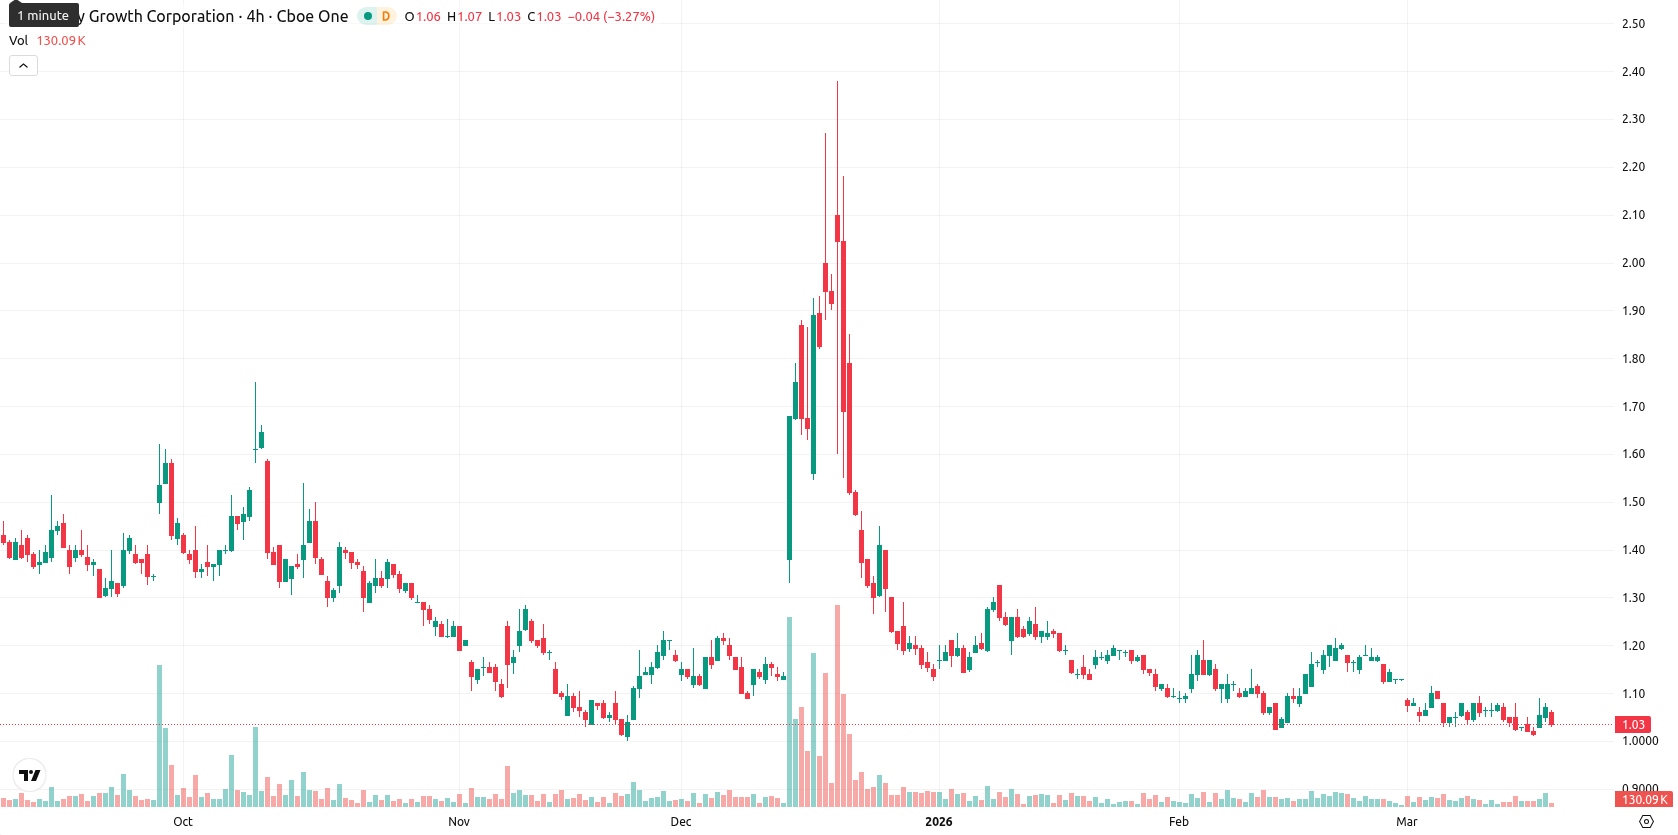
Canopy Growth Corporation (CGC) is trading at $1.04, marking a daily decline of 3.27%. The price remains below the SMA-20 ($1.10), SMA-50 ($1.13), and SMA-200 ($1.26), highlighting persistent seller pressure across all primary timeframes.
Highlights
- CGC exhibits persistent seller pressure, trading below key short-, medium-, and long-term moving averages.
- Bearish momentum dominates, with multiple indicators—MACD, RSI, and trend signals—aligning for further downside risk.
- Expected five-day price action is capped between $1.02 support and $1.10 resistance, with sub-20% probability of a bullish reversal.
Bearish technical momentum as CGC tests resistance and lags oscillators
CGC continues to trade beneath major technical benchmarks, with the Ichimoku Kijun at $1.11 serving as immediate resistance above the current price. Technical signals are predominantly bearish: MACD indicates a sell on both daily and weekly frames, the ADX is weak and neutral, and RSI readings on D1 (46.64) and W1 (43.55) confirm prevailing downside momentum. The Stoch RSI is overbought on D1, CCI is neutral, and Bull/Bear Power (BBP) on D1 shows a strong buy reading, although this contrasts with the broader downward trend. Awesome Oscillator is neutral, and intraday price action remains subdued near the lower end of today’s $1.03–$1.07 range, indicating sustained pressure.
Sideways consolidation likely as upside signals remain absent
For the coming week, the typical volatility band is projected between $1.02 and $1.10, consistent with recent market behavior. There is less than a 20% probability of price appreciation, as weekly RSI, MACD, and SMA-50 all point to continued downside and there are no weekly bullish signals. The most probable scenario is for CGC to consolidate in a sideways corridor with support near $1.02 and resistance at $1.10. Upside momentum would require a move above the Kijun and $1.10 resistance, while a drop below $1.02 would expose CGC to further declines.
Earlier, analysts noted that Canopy Growth faced sustained selling pressure and generally negative momentum despite strategic efforts to bolster its market position. The ongoing bearish technical signals and subdued volatility reinforce this outlook, making a breakdown below the $1.02 support a key downside risk to monitor in the near term.


Latest Canopy Growth News


-
 Afghanistan
-
 Albania
-
 Algeria
-
 Angola
-
 Argentina
-
 Armenia
-
 Australia
-
 Austria
-
 Azerbaijan
-
 Bahamas
-
 Bahrain
-
 Bangladesh
-
 Belarus
-
 Belgium
-
 Bolivia
-
 Botswana
-
 Brazil
-
 Brunei
-
 Bulgaria
-
 Cambodia
-
 Cameroon
-
 Canada
-
 Chile
Chile
-
 China
China
-
 Colombia
-
 Congo
Congo
-
 Costa Rica
-
 Cote d'Ivoire
-
 Croatia
-
 Cuba
Cuba
-
 Cyprus
-
 Czechia
-
 DR Congo
-
 Denmark
-
 Dominican Republic
-
 Ecuador
-
 Egypt
Egypt
-
 El Salvador
-
 Estonia
-
 Eswatini
-
 Ethiopia
-
 Finland
-
 France
-
 Georgia
-
 Germany
-
 Ghana
Ghana
-
 Greece
-
 Haiti
Haiti
-
 Hong Kong
-
 Hungary
-
 India
India
-
 Indonesia
-
 Iran, Islamic republic
-
 Iraq
Iraq
-
 Ireland
-
 Israel
-
 Italy
Italy
-
 Jamaica
-
 Japan
Japan
-
 Jordan
-
 Kazakhstan
-
 Kenya
Kenya
-
 Korea
Korea
-
 Kuwait
-
 Kyrgyzstan
-
 Laos
Laos
-
 Latvia
-
 Lebanon
-
 Lesotho
-
 Libya
Libya
-
 Lithuania
-
 Luxembourg
-
 Madagascar
-
 Malaysia
-
 Malta
Malta
-
 Mauritius
-
 Mexico
-
 Moldova
-
 Mongolia
-
 Montenegro
-
 Morocco
-
 Mozambique
-
 Myanmar
-
 Namibia
-
 Nepal
Nepal
-
 Netherlands
-
 New Zealand
-
 Nigeria
-
 North Macedonia
-
 Norway
-
 Oman
Oman
-
 Pakistan
-
 Palestine
-
 Panama
-
 Papua New Guinea
-
 Paraguay
-
 Peru
Peru
-
 Philippines
-
 Poland
-
 Portugal
-
 Puerto Rico
-
 Qatar
Qatar
-
 Reunion
-
 Romania
-
 Rwanda
-
 Saudi Arabia
-
 Serbia
-
 Singapore
-
 Slovakia
-
 Slovenia
-
 Somalia
-
 South Africa
-
 Spain
Spain
-
 Sri Lanka
-
 Sweden
-
 Switzerland
-
 Syria
Syria
-
 Taiwan
-
 Tajikistan
-
 Tanzania
-
 Thailand
-
 Trinidad and Tobago
-
 Tunisia
-
 Turkey
-
 UAE
UAE
-
 Uganda
-
 Ukraine
-
 United Kingdom
-
United States
-
 Uruguay
-
 Uzbekistan
-
 Venezuela
-
 Vietnam
-
 Yemen
Yemen
-
 Zambia
-
 Zimbabwe
- Forex
- Crypto
