
Alphabet stock trades down as PubMatic lawsuit targets Google digital advertising

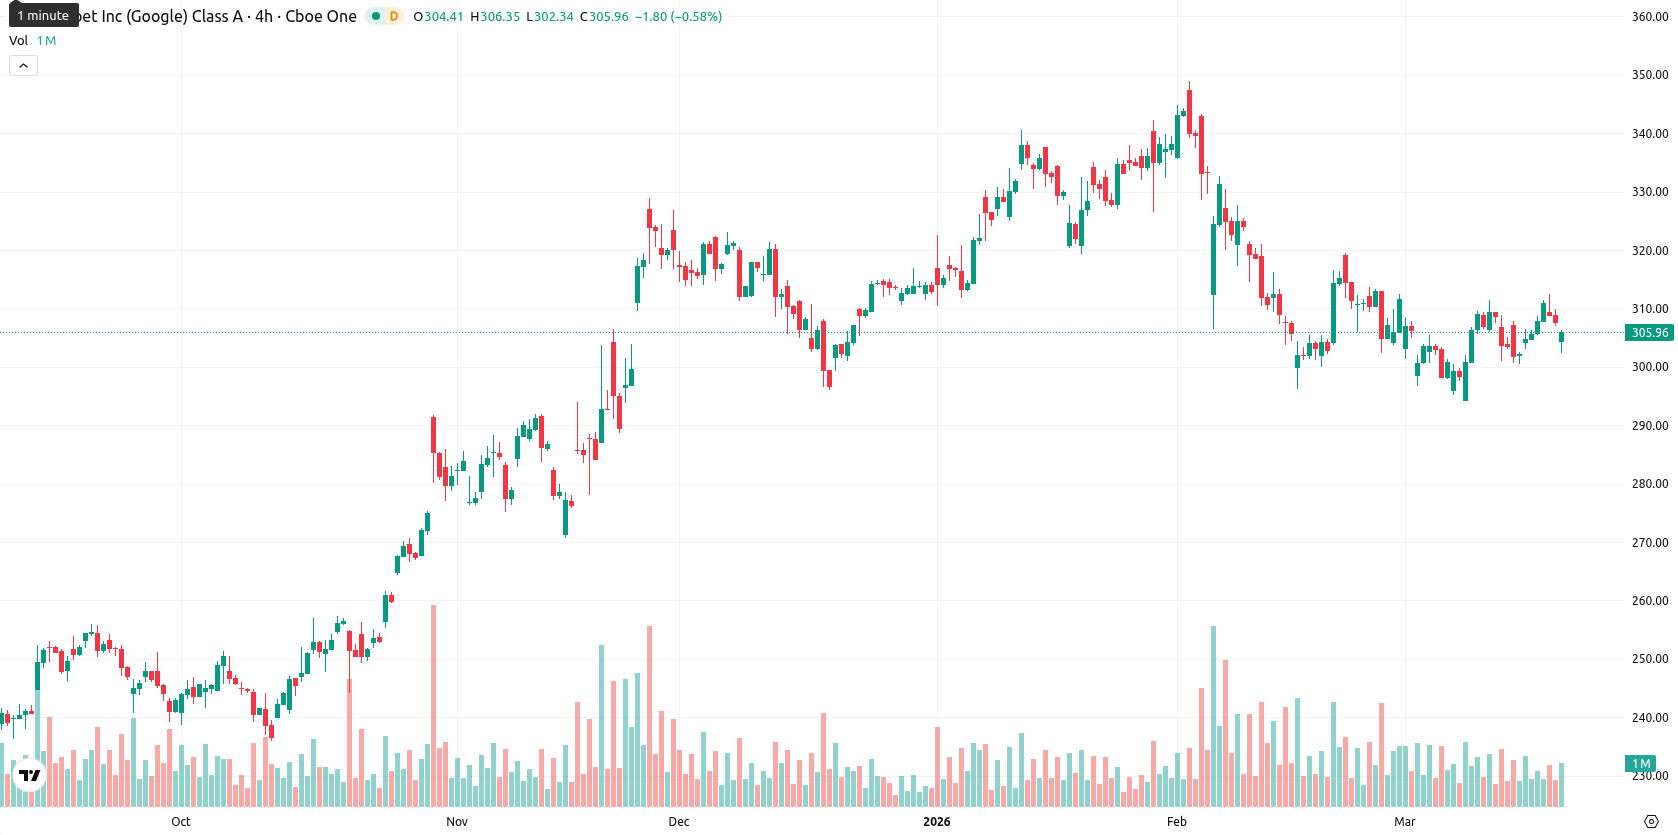
Alphabet Inc. (GOOGL) is trading at $305.75, down 0.69% for the day. The price is positioned just below the SMA-20 ($306.84), well under the SMA-50 ($318.55), and remains significantly above the SMA-200 ($258.51), which hints at short- and medium-term downward pressure but continued long-term support.
Highlights
- Heightened geopolitical risks and demand for AI have accelerated Alphabet's investments in European and defense-related technology solutions.
- Alphabet faces intensifying regulatory scrutiny, with lawsuits over its advertising practices and increased oversight on infrastructure, notably energy procurement initiatives.
- GOOGL trades below key short- and medium-term technical levels, with an expected weekly range of $295.00–$312.00 amid choppy sentiment and upside bias if $307.88 is surpassed.
Regulatory scrutiny and AI demand drive Alphabet’s European strategy
Geopolitical tensions have increased demand for sovereign technology solutions and advanced AI, influencing Alphabet’s strategic investments in Europe and the defense sector. Ongoing regulatory risks have intensified, as evidenced by lawsuits such as the September 8, 2025, suit by PubMatic against Google for alleged unfair competition in digital advertising. State-led initiatives to shape energy procurement frameworks, like Google’s Clean Transition Tariff for its Detroit data center, signal expanding regulatory oversight over Alphabet’s infrastructure and procurement strategies.
Mixed momentum persists with downside bias at technical resistance
GOOGL’s technical setup points to mixed signals. The stock is trading just below the SMA-20 ($306.84) and significantly under the SMA-50 ($318.55), while remaining well above the SMA-200 ($258.51), showing near-term weakness but persistent long-term strength. The Ichimoku Kijun level at $307.88 stands as immediate resistance. Momentum indicators on the daily chart are mostly negative: MACD shows a strong sell, ADX also signals sell, RSI is neutral at 48.05 but leans towards bearish, and Stoch RSI is overbought. CCI points to a modest buy, and BBP is in overbought territory, indicating recent buyer dominance despite the day’s downward move. Today’s session opened with a small downward gap and the price is currently near the middle of the daily trading range ($302.56 – $306.34), highlighting moderate volatility and ongoing selling pressure.
Bullish reversal requires $307.88 breakout amid consolidation signals
In the coming week, GOOGL’s expected price corridor is set between $295.00 and $312.00, reflecting typical weekly volatility at current levels. Most major weekly technical indicators — including RSI, ADX, MACD, and the MA-50 — are flagging buy or strong buy, suggesting a greater than 80% probability of a short-term upward move, and making a pronounced decline less likely. The primary scenario is for price to consolidate sideways within the $295.00 – $312.00 band. A bullish scenario would be triggered by a break and close above resistance at $307.88, while a fall below support near $295.00 would shift the outlook bearish.
In a recent review, analysts highlighted Alphabet’s persistent long-term support despite short-term technical headwinds and market indecision. The current analysis reinforces that view while incorporating fresh regulatory and geopolitical challenges, suggesting traders should monitor the evolving $295–$312 consolidation band for any decisive breakout or breakdown.


-
 Afghanistan
-
 Albania
-
 Algeria
-
 Angola
-
 Argentina
-
 Armenia
-
 Australia
-
 Austria
-
 Azerbaijan
-
 Bahamas
-
 Bahrain
-
 Bangladesh
-
 Belarus
-
 Belgium
-
 Bolivia
-
 Botswana
-
 Brazil
-
 Brunei
-
 Bulgaria
-
 Cambodia
-
 Cameroon
-
 Canada
-
 Chile
Chile
-
 China
China
-
 Colombia
-
 Congo
Congo
-
 Costa Rica
-
 Cote d'Ivoire
-
 Croatia
-
 Cuba
Cuba
-
 Cyprus
-
 Czechia
-
 DR Congo
-
 Denmark
-
 Dominican Republic
-
 Ecuador
-
 Egypt
Egypt
-
 El Salvador
-
 Estonia
-
 Eswatini
-
 Ethiopia
-
 Finland
-
 France
-
 Georgia
-
 Germany
-
 Ghana
Ghana
-
 Greece
-
 Haiti
Haiti
-
 Hong Kong
-
 Hungary
-
 India
India
-
 Indonesia
-
 Iran, Islamic republic
-
 Iraq
Iraq
-
 Ireland
-
 Israel
-
 Italy
Italy
-
 Jamaica
-
 Japan
Japan
-
 Jordan
-
 Kazakhstan
-
 Kenya
Kenya
-
 Korea
Korea
-
 Kuwait
-
 Kyrgyzstan
-
 Laos
Laos
-
 Latvia
-
 Lebanon
-
 Lesotho
-
 Libya
Libya
-
 Lithuania
-
 Luxembourg
-
 Madagascar
-
 Malaysia
-
 Malta
Malta
-
 Mauritius
-
 Mexico
-
 Moldova
-
 Mongolia
-
 Montenegro
-
 Morocco
-
 Mozambique
-
 Myanmar
-
 Namibia
-
 Nepal
Nepal
-
 Netherlands
-
 New Zealand
-
 Nigeria
-
 North Macedonia
-
 Norway
-
 Oman
Oman
-
 Pakistan
-
 Palestine
-
 Panama
-
 Papua New Guinea
-
 Paraguay
-
 Peru
Peru
-
 Philippines
-
 Poland
-
 Portugal
-
 Puerto Rico
-
 Qatar
Qatar
-
 Reunion
-
 Romania
-
 Rwanda
-
 Saudi Arabia
-
 Serbia
-
 Singapore
-
 Slovakia
-
 Slovenia
-
 Somalia
-
 South Africa
-
 Spain
Spain
-
 Sri Lanka
-
 Sweden
-
 Switzerland
-
 Syria
Syria
-
 Taiwan
-
 Tajikistan
-
 Tanzania
-
 Thailand
-
 Trinidad and Tobago
-
 Tunisia
-
 Turkey
-
 UAE
UAE
-
 Uganda
-
 Ukraine
-
 United Kingdom
-
United States
-
 Uruguay
-
 Uzbekistan
-
 Venezuela
-
 Vietnam
-
 Yemen
Yemen
-
 Zambia
-
 Zimbabwe
- Forex
- Crypto
