
Negative momentum signals, oversold oscillators: Affirm stock gains 3.45%

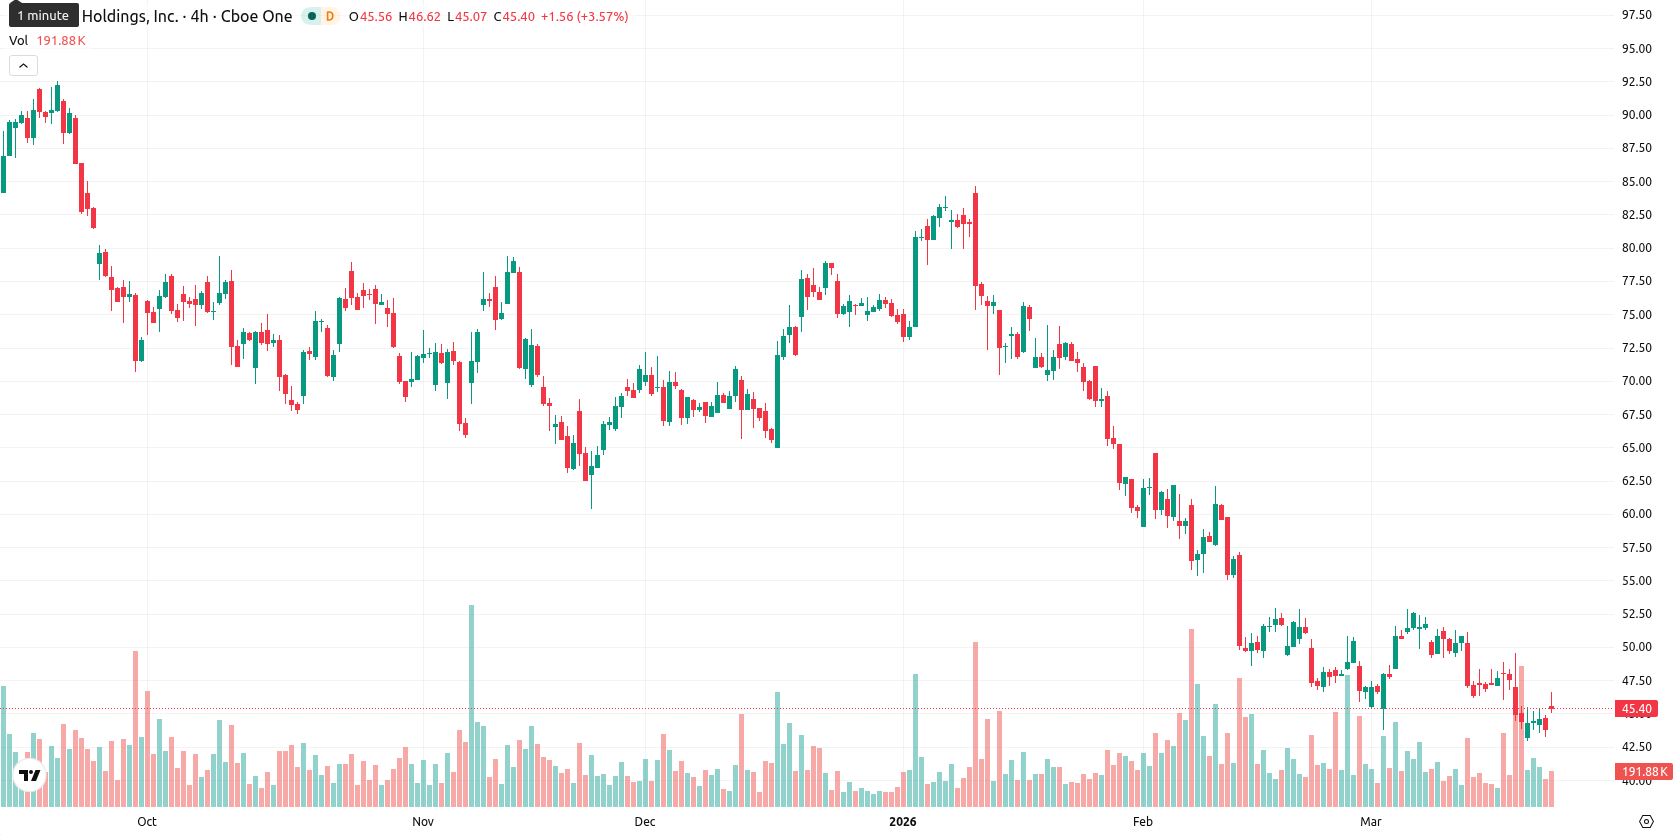
Affirm Holdings, Inc. (AFRM) is trading at $45.32, up 3.45% for the day. The price remains well below the SMA-20 ($48.12), SMA-50 ($57.85), and SMA-200 ($69.03) — underscoring persistent downward pressure in the short-, medium-, and long-term trends. The current level is also beneath the D1 Ichimoku Kijun at $49.94, indicating immediate resistance overhead.
Highlights
- AFRM remains firmly below major moving averages and key Ichimoku resistance, signaling entrenched bearish momentum across all timeframes.
- Momentum and oscillator indicators confirm persistent selling pressure, with the stock appearing technically oversold but lacking reversal signals.
- Expected trading range for the week is $43.00 to $47.50, with further downside likely unless $49.94 resistance is decisively broken.
Bearish signals dominate despite oversold technical readings
Momentum signals remain broadly negative, with both MACD and ADX indicating sustained selling pressure. Oscillator readings show the stock is in oversold territory: RSI is at 32.14 (Sell), Stoch RSI and CCI are both oversold, and the BBP's reading of -1.88 highlights continued seller dominance intraday. The Awesome Oscillator confirms the bearish momentum. Today's session opened with a small gap up at $45.40, moving into the middle of the intraday range ($45.10 – $46.62), with moderate volatility and early strength followed by consolidation. Despite a technical bounce, there is a clear divergence between persistent bearish momentum and short-term oversold conditions across oscillators.
Downside risk elevated as rangebound outlook prevails
Looking to the week ahead, the price is expected to trade between $43.00 and $47.50, reflecting typical volatility relative to current levels. There is a very low probability (less than 20%) of a sustained upward move, so further downside risk remains elevated. The base case is for AFRM to remain rangebound as oversold signals persist. In a bullish scenario, a break above $49.94 could prompt a short-term rally, while a drop below $43.00 would likely accelerate losses as daily and weekly technical indicators remain negative.
Earlier, analysts noted that Affirm Holdings was exhibiting persistent bearish momentum with sellers maintaining control across all major timeframes. The latest price action, while showing a technical bounce, reinforces the downside risk as negative momentum persists—making the $43.00 level a critical threshold for any potential shift in near-term direction.


Latest Affirm News


-
 Afghanistan
-
 Albania
-
 Algeria
-
 Angola
-
 Argentina
-
 Armenia
-
 Australia
-
 Austria
-
 Azerbaijan
-
 Bahamas
-
 Bahrain
-
 Bangladesh
-
 Belarus
-
 Belgium
-
 Bolivia
-
 Botswana
-
 Brazil
-
 Brunei
-
 Bulgaria
-
 Cambodia
-
 Cameroon
-
 Canada
-
 Chile
Chile
-
 China
China
-
 Colombia
-
 Congo
Congo
-
 Costa Rica
-
 Cote d'Ivoire
-
 Croatia
-
 Cuba
Cuba
-
 Cyprus
-
 Czechia
-
 DR Congo
-
 Denmark
-
 Dominican Republic
-
 Ecuador
-
 Egypt
Egypt
-
 El Salvador
-
 Estonia
-
 Eswatini
-
 Ethiopia
-
 Finland
-
 France
-
 Georgia
-
 Germany
-
 Ghana
Ghana
-
 Greece
-
 Haiti
Haiti
-
 Hong Kong
-
 Hungary
-
 India
India
-
 Indonesia
-
 Iran, Islamic republic
-
 Iraq
Iraq
-
 Ireland
-
 Israel
-
 Italy
Italy
-
 Jamaica
-
 Japan
Japan
-
 Jordan
-
 Kazakhstan
-
 Kenya
Kenya
-
 Korea
Korea
-
 Kuwait
-
 Kyrgyzstan
-
 Laos
Laos
-
 Latvia
-
 Lebanon
-
 Lesotho
-
 Libya
Libya
-
 Lithuania
-
 Luxembourg
-
 Madagascar
-
 Malaysia
-
 Malta
Malta
-
 Mauritius
-
 Mexico
-
 Moldova
-
 Mongolia
-
 Montenegro
-
 Morocco
-
 Mozambique
-
 Myanmar
-
 Namibia
-
 Nepal
Nepal
-
 Netherlands
-
 New Zealand
-
 Nigeria
-
 North Macedonia
-
 Norway
-
 Oman
Oman
-
 Pakistan
-
 Palestine
-
 Panama
-
 Papua New Guinea
-
 Paraguay
-
 Peru
Peru
-
 Philippines
-
 Poland
-
 Portugal
-
 Puerto Rico
-
 Qatar
Qatar
-
 Reunion
-
 Romania
-
 Rwanda
-
 Saudi Arabia
-
 Serbia
-
 Singapore
-
 Slovakia
-
 Slovenia
-
 Somalia
-
 South Africa
-
 Spain
Spain
-
 Sri Lanka
-
 Sweden
-
 Switzerland
-
 Syria
Syria
-
 Taiwan
-
 Tajikistan
-
 Tanzania
-
 Thailand
-
 Trinidad and Tobago
-
 Tunisia
-
 Turkey
-
 UAE
UAE
-
 Uganda
-
 Ukraine
-
 United Kingdom
-
United States
-
 Uruguay
-
 Uzbekistan
-
 Venezuela
-
 Vietnam
-
 Yemen
Yemen
-
 Zambia
-
 Zimbabwe
- Forex
- Crypto
