
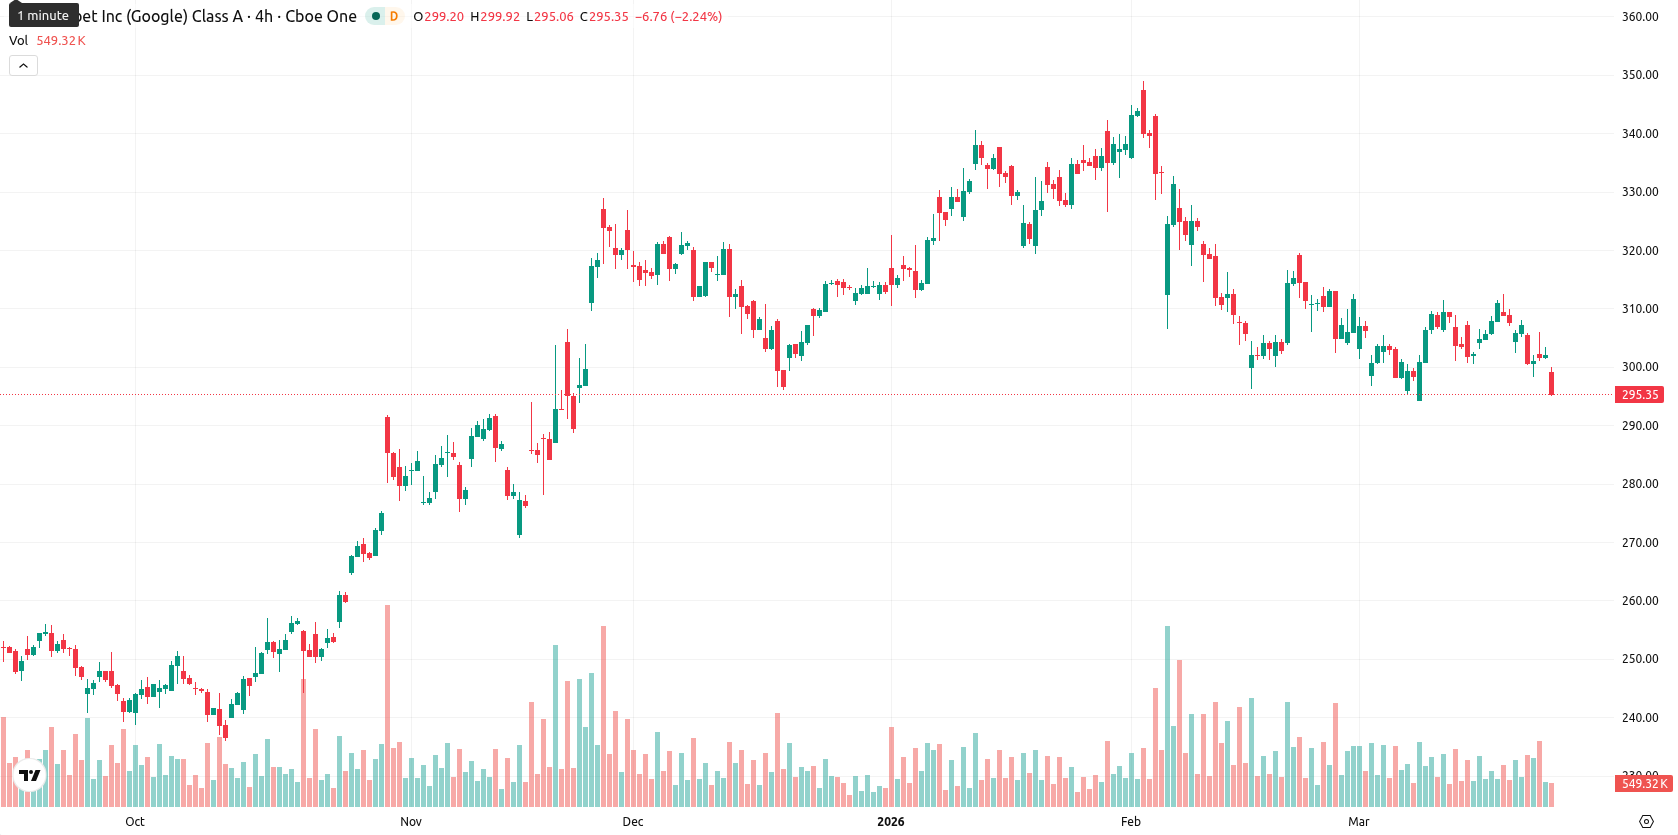
-2.06% for Alphabet stock as price breaks below short-term moving averages

Alphabet Inc. (GOOGL) is trading at $295.80, down $6.22 or 2.06% for the day. The price is below its SMA-20 ($305.86) and SMA-50 ($317.51), but remains above the SMA-200 ($260.54), indicating short- and medium-term downward pressure, while long-term support holds.
Highlights
- Alphabet declared its inaugural dividend policy, underpinned by cash reserves surpassing $150 billion and forecast-beating earnings.
- Institutional investors increased holdings in Q4 2025, while Google Cloud backlog neared $240 billion despite market selling pressure.
- GOOGL trades under key short- and medium-term averages with downside momentum, but weekly outlook favors $290.00–$306.00 consolidation.
Dividend debut and earnings beat amid persistent selling pressure
Alphabet announced its first-ever dividend payout on March 23, 2026, accompanied by cash reserves exceeding $150 billion to support this policy. The company reported earnings that surpassed forecasts and noted Google Cloud's backlog approaching $240 billion. Major institutional shareholders increased their stakes during the fourth quarter of 2025, though price action has remained under broader selling pressure.
Technical momentum weakens as multiple sell signals persist
From a technical standpoint, short- and medium-term signals for GOOGL are negative, as the asset trades below the SMA-20 and SMA-50, yet long-term structure remains constructive above the SMA-200. The Ichimoku Kijun at $306.80 serves as immediate resistance, suggesting a potential cap on upward moves. MACD and ADX on the daily chart both register 'Sell', with daily RSI at 42.7 and CCI at –51.95, indicating persistent downside momentum without reaching oversold extremes. Stoch RSI is mixed, generally neutral on the daily chart but with several intraday frames oversold, while BBP remains overbought on D1 but is moving lower, signaling sellers becoming more active intraday.
Consolidation outlook as upside capped by resistance zone
The expected price band for the next five trading days is $290.00 – $306.00, reflecting typical volatility relative to current levels. The probability of a price increase stands at approximately 75%, based on bullish MA-50, RSI, ADX, and MACD readings on the weekly chart, whereas a decline is less likely. The baseline scenario calls for consolidation in a sideways range; a break above $306.80 would signal a bullish attempt at immediate resistance, while a move below $295.00 could expose key support levels near the SMA-200.
Earlier, analysts noted that Alphabet's price action reflected limited investor conviction amid broader market uncertainties, with technical support levels critical for near-term direction. Currently, while new dividend and earnings developments have strengthened Alphabet’s strategic position, the technical outlook suggests that a decisive move above the $306.80 resistance or below $295.00 support may set the tone for the next phase of trading.


-
 Afghanistan
-
 Albania
-
 Algeria
-
 Angola
-
 Argentina
-
 Armenia
-
 Australia
-
 Austria
-
 Azerbaijan
-
 Bahamas
-
 Bahrain
-
 Bangladesh
-
 Belarus
-
 Belgium
-
 Bolivia
-
 Botswana
-
 Brazil
-
 Brunei
-
 Bulgaria
-
 Cambodia
-
 Cameroon
-
 Canada
-
 Chile
Chile
-
 China
China
-
 Colombia
-
 Congo
Congo
-
 Costa Rica
-
 Cote d'Ivoire
-
 Croatia
-
 Cuba
Cuba
-
 Cyprus
-
 Czechia
-
 DR Congo
-
 Denmark
-
 Dominican Republic
-
 Ecuador
-
 Egypt
Egypt
-
 El Salvador
-
 Estonia
-
 Eswatini
-
 Ethiopia
-
 Finland
-
 France
-
 Georgia
-
 Germany
-
 Ghana
Ghana
-
 Greece
-
 Haiti
Haiti
-
 Hong Kong
-
 Hungary
-
 India
India
-
 Indonesia
-
 Iran, Islamic republic
-
 Iraq
Iraq
-
 Ireland
-
 Israel
-
 Italy
Italy
-
 Jamaica
-
 Japan
Japan
-
 Jordan
-
 Kazakhstan
-
 Kenya
Kenya
-
 Korea
Korea
-
 Kuwait
-
 Kyrgyzstan
-
 Laos
Laos
-
 Latvia
-
 Lebanon
-
 Lesotho
-
 Libya
Libya
-
 Lithuania
-
 Luxembourg
-
 Madagascar
-
 Malaysia
-
 Malta
Malta
-
 Mauritius
-
 Mexico
-
 Moldova
-
 Mongolia
-
 Montenegro
-
 Morocco
-
 Mozambique
-
 Myanmar
-
 Namibia
-
 Nepal
Nepal
-
 Netherlands
-
 New Zealand
-
 Nigeria
-
 North Macedonia
-
 Norway
-
 Oman
Oman
-
 Pakistan
-
 Palestine
-
 Panama
-
 Papua New Guinea
-
 Paraguay
-
 Peru
Peru
-
 Philippines
-
 Poland
-
 Portugal
-
 Puerto Rico
-
 Qatar
Qatar
-
 Reunion
-
 Romania
-
 Rwanda
-
 Saudi Arabia
-
 Serbia
-
 Singapore
-
 Slovakia
-
 Slovenia
-
 Somalia
-
 South Africa
-
 Spain
Spain
-
 Sri Lanka
-
 Sweden
-
 Switzerland
-
 Syria
Syria
-
 Taiwan
-
 Tajikistan
-
 Tanzania
-
 Thailand
-
 Trinidad and Tobago
-
 Tunisia
-
 Turkey
-
 UAE
UAE
-
 Uganda
-
 Ukraine
-
 United Kingdom
-
United States
-
 Uruguay
-
 Uzbekistan
-
 Venezuela
-
 Vietnam
-
 Yemen
Yemen
-
 Zambia
-
 Zimbabwe
- Forex
- Crypto
