
Pronounced bearish indicators push Affirm stock lower despite no fresh company news

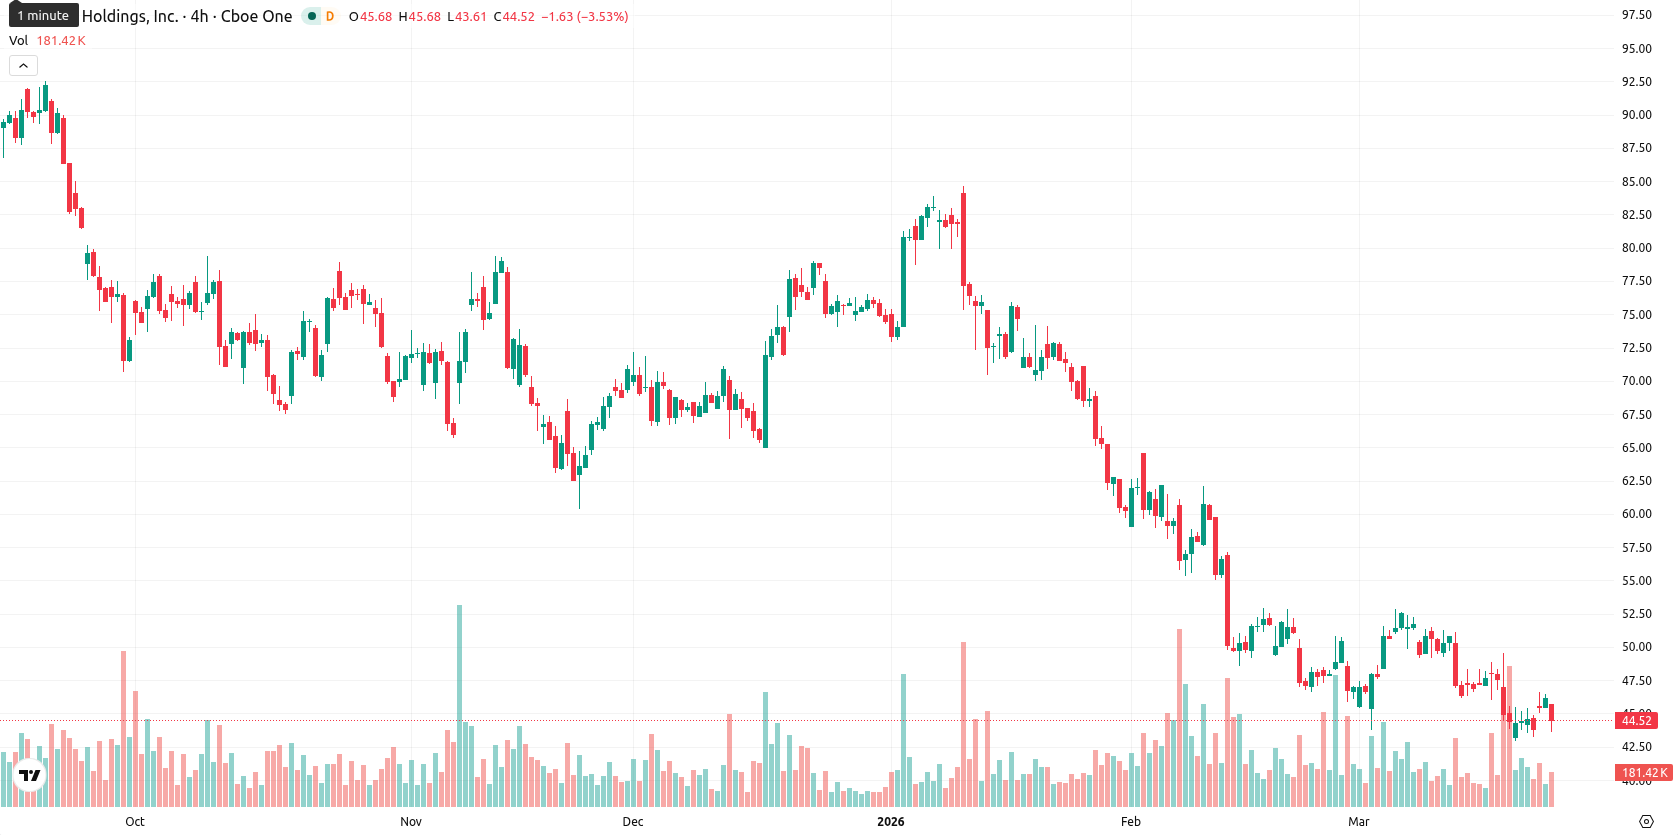
Affirm Holdings, Inc. (AFRM) is trading at $44.55, representing a daily movement down by 3.50%. The price sits well below the key moving averages — SMA-20 at $48.07, SMA-50 at $57.14, and SMA-200 at $68.99 — indicating pronounced selling pressure across short, medium, and long-term trends.
Highlights
- Affirm faces no recent corporate developments or regulatory actions, leaving market focus on price behavior and technicals.
- Bearish momentum persists as AFRM trades below major moving averages and faces immediate resistance at 47.84.
- Market expects AFRM to move within a $42.00–$47.00 range next week, with a downside break likely to accelerate declines.
Muted sentiment as no news or regulatory catalysts emerge
No recent corporate or regulatory actions directly involving Affirm have been reported.
Strong bearish momentum as major indicators confirm downside bias
The technical setup for AFRM is bearish. The current price is beneath all major moving averages, with the Ichimoku Kijun resistance at $47.84 highlighted as the nearest resistance on the chart. MACD (D1) signals a strong sell, ADX at 31.18 confirms the trend strength, and both RSI and CCI point to ongoing downside momentum with no oversold signals. Although the Stoch RSI flashes a strong buy and HMA hints at short-term rebound potential, overall momentum indicators remain decisively negative. BBP registers as oversold, reflecting strong seller dominance intraday, with the price action staying near the session’s lower end after a minor gap down at the open.
Further declines likely as rebound depends on key resistance break
For the short-term, the expected volatility band relative to current levels is $42.00 – $47.00. There is a low probability (less than 20%) of a price increase, with further declines the more likely scenario. AFRM is likely to fluctuate sideways between $42.00 and $47.00 as the market absorbs recent losses. A rebound toward $47.00 could be triggered only by sustained buying above $47.84, while a break below $42.00 may result in accelerated downside with limited technical support.
Earlier, analysts noted that Affirm Holdings continued to exhibit broad-based bearish momentum under sustained selling pressure. The latest technical signals and price action reinforce this outlook, with traders advised to monitor the $42.00 level as a potential trigger for renewed downside risk in the near term.


Latest Affirm News


-
 Afghanistan
-
 Albania
-
 Algeria
-
 Angola
-
 Argentina
-
 Armenia
-
 Australia
-
 Austria
-
 Azerbaijan
-
 Bahamas
-
 Bahrain
-
 Bangladesh
-
 Belarus
-
 Belgium
-
 Bolivia
-
 Botswana
-
 Brazil
-
 Brunei
-
 Bulgaria
-
 Cambodia
-
 Cameroon
-
 Canada
-
 Chile
Chile
-
 China
China
-
 Colombia
-
 Congo
Congo
-
 Costa Rica
-
 Cote d'Ivoire
-
 Croatia
-
 Cuba
Cuba
-
 Cyprus
-
 Czechia
-
 DR Congo
-
 Denmark
-
 Dominican Republic
-
 Ecuador
-
 Egypt
Egypt
-
 El Salvador
-
 Estonia
-
 Eswatini
-
 Ethiopia
-
 Finland
-
 France
-
 Georgia
-
 Germany
-
 Ghana
Ghana
-
 Greece
-
 Haiti
Haiti
-
 Hong Kong
-
 Hungary
-
 India
India
-
 Indonesia
-
 Iran, Islamic republic
-
 Iraq
Iraq
-
 Ireland
-
 Israel
-
 Italy
Italy
-
 Jamaica
-
 Japan
Japan
-
 Jordan
-
 Kazakhstan
-
 Kenya
Kenya
-
 Korea
Korea
-
 Kuwait
-
 Kyrgyzstan
-
 Laos
Laos
-
 Latvia
-
 Lebanon
-
 Lesotho
-
 Libya
Libya
-
 Lithuania
-
 Luxembourg
-
 Madagascar
-
 Malaysia
-
 Malta
Malta
-
 Mauritius
-
 Mexico
-
 Moldova
-
 Mongolia
-
 Montenegro
-
 Morocco
-
 Mozambique
-
 Myanmar
-
 Namibia
-
 Nepal
Nepal
-
 Netherlands
-
 New Zealand
-
 Nigeria
-
 North Macedonia
-
 Norway
-
 Oman
Oman
-
 Pakistan
-
 Palestine
-
 Panama
-
 Papua New Guinea
-
 Paraguay
-
 Peru
Peru
-
 Philippines
-
 Poland
-
 Portugal
-
 Puerto Rico
-
 Qatar
Qatar
-
 Reunion
-
 Romania
-
 Rwanda
-
 Saudi Arabia
-
 Serbia
-
 Singapore
-
 Slovakia
-
 Slovenia
-
 Somalia
-
 South Africa
-
 Spain
Spain
-
 Sri Lanka
-
 Sweden
-
 Switzerland
-
 Syria
Syria
-
 Taiwan
-
 Tajikistan
-
 Tanzania
-
 Thailand
-
 Trinidad and Tobago
-
 Tunisia
-
 Turkey
-
 UAE
UAE
-
 Uganda
-
 Ukraine
-
 United Kingdom
-
United States
-
 Uruguay
-
 Uzbekistan
-
 Venezuela
-
 Vietnam
-
 Yemen
Yemen
-
 Zambia
-
 Zimbabwe
- Forex
- Crypto
