

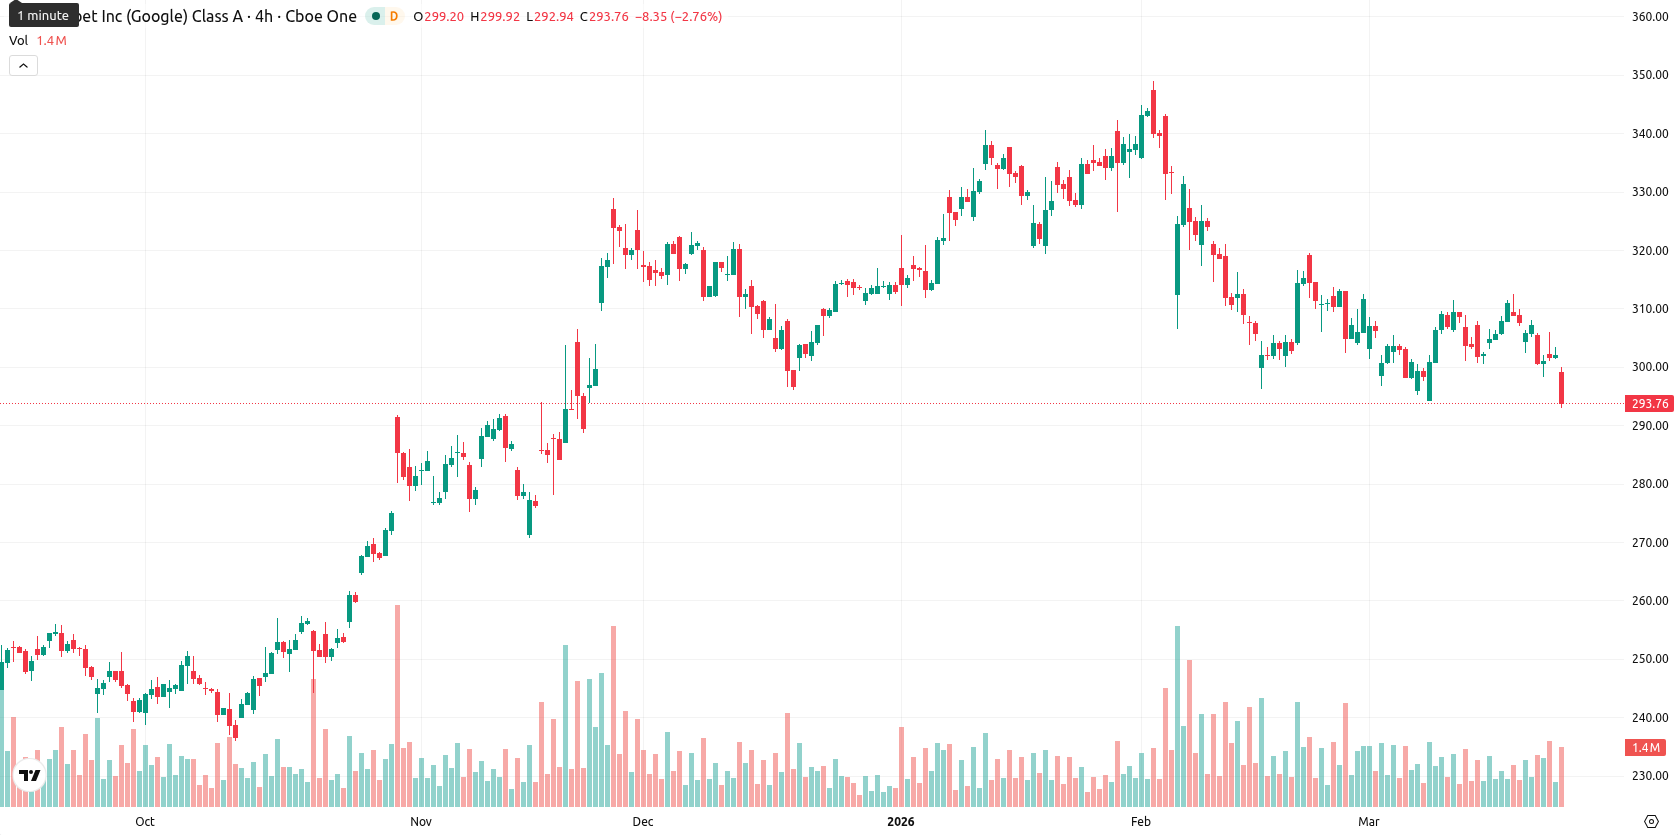
Alphabet Inc. (GOOGL) is trading at $292.42 after a daily decline of 3.18%, placing it below the MA-20 ($305.86) and MA-50 ($317.51) but well above the MA-200 ($260.54). The current price is situated beneath the Ichimoku Kijun level at $306.80, showing short- and medium-term selling pressure while maintaining long-term technical support.
Highlights
- Rising geopolitical risk from U.S.–Iran tensions is driving oil prices higher, increasing energy costs for Alphabet’s data center and AI operations.
- Persistent Middle East conflict and EU antitrust actions are constraining Alphabet’s revenue growth prospects and delaying rate-cut expectations into 2027.
- GOOGL is under short-term selling pressure, likely to consolidate within a $285–$305 range as momentum and volatility remain elevated.
Geopolitical risk and EU regulation weigh on Alphabet’s outlook
Escalating conflict between the U.S. and Iran has increased geopolitical risk and driven oil prices higher, intensifying inflationary pressures and elevating operating costs for Alphabet’s energy-intensive data center and AI operations. Ongoing hostilities in the Middle East have created persistent uncertainty for tech sector investments, with rate-cut expectations by the Federal Reserve shifting further into 2027. Regulatory obstacles in the European Union, including active antitrust investigations into Google’s search and app store dominance, are exerting direct pressure on Alphabet’s core business and potentially constraining revenue growth within the region.
Sustained downside momentum with volatility amplifying sell signals
Momentum remains negative on the daily timeframe, with the MACD highlighting strong downward pressure and the ADX confirming a sell bias. The RSI, Stoch RSI, and CCI all indicate Alphabet shares are drifting toward oversold conditions, and BBP underscores persistent seller dominance intraday. The Awesome Oscillator (AO) further aligns with this negative trend, while the price remains near the session low amid heightened volatility and a clear absence of upward momentum.
Rangebound trading likely as opposing indicators offset direction
Over the next five trading days, the expected volatility band is seen between $285 and $305, positioning the current price in the middle of this range. The probability of an upward or downward move is roughly balanced at 50%, given the conflicting signals between daily and weekly technical indicators. Baseline scenario calls for price consolidation within the $285–$305 band, while a break above resistance near $307 could lead to a bullish move and a slide below $285 support could accelerate downside momentum.
Previously it was reported that persistent near-term selling pressure weighed on Alphabet shares despite strong long-term fundamentals. The current analysis expands on this outlook by highlighting heightened geopolitical risks and European regulatory challenges, suggesting that the $285–$305 volatility band should be monitored closely as a decisive move outside this range may set the next trend direction.


-
 Afghanistan
-
 Albania
-
 Algeria
-
 Angola
-
 Argentina
-
 Armenia
-
 Australia
-
 Austria
-
 Azerbaijan
-
 Bahamas
-
 Bahrain
-
 Bangladesh
-
 Belarus
-
 Belgium
-
 Bolivia
-
 Botswana
-
 Brazil
-
 Brunei
-
 Bulgaria
-
 Cambodia
-
 Cameroon
-
 Canada
-
 Chile
Chile
-
 China
China
-
 Colombia
-
 Congo
Congo
-
 Costa Rica
-
 Cote d'Ivoire
-
 Croatia
-
 Cuba
Cuba
-
 Cyprus
-
 Czechia
-
 DR Congo
-
 Denmark
-
 Dominican Republic
-
 Ecuador
-
 Egypt
Egypt
-
 El Salvador
-
 Estonia
-
 Eswatini
-
 Ethiopia
-
 Finland
-
 France
-
 Georgia
-
 Germany
-
 Ghana
Ghana
-
 Greece
-
 Haiti
Haiti
-
 Hong Kong
-
 Hungary
-
 India
India
-
 Indonesia
-
 Iran, Islamic republic
-
 Iraq
Iraq
-
 Ireland
-
 Israel
-
 Italy
Italy
-
 Jamaica
-
 Japan
Japan
-
 Jordan
-
 Kazakhstan
-
 Kenya
Kenya
-
 Korea
Korea
-
 Kuwait
-
 Kyrgyzstan
-
 Laos
Laos
-
 Latvia
-
 Lebanon
-
 Lesotho
-
 Libya
Libya
-
 Lithuania
-
 Luxembourg
-
 Madagascar
-
 Malaysia
-
 Malta
Malta
-
 Mauritius
-
 Mexico
-
 Moldova
-
 Mongolia
-
 Montenegro
-
 Morocco
-
 Mozambique
-
 Myanmar
-
 Namibia
-
 Nepal
Nepal
-
 Netherlands
-
 New Zealand
-
 Nigeria
-
 North Macedonia
-
 Norway
-
 Oman
Oman
-
 Pakistan
-
 Palestine
-
 Panama
-
 Papua New Guinea
-
 Paraguay
-
 Peru
Peru
-
 Philippines
-
 Poland
-
 Portugal
-
 Puerto Rico
-
 Qatar
Qatar
-
 Reunion
-
 Romania
-
 Rwanda
-
 Saudi Arabia
-
 Serbia
-
 Singapore
-
 Slovakia
-
 Slovenia
-
 Somalia
-
 South Africa
-
 Spain
Spain
-
 Sri Lanka
-
 Sweden
-
 Switzerland
-
 Syria
Syria
-
 Taiwan
-
 Tajikistan
-
 Tanzania
-
 Thailand
-
 Trinidad and Tobago
-
 Tunisia
-
 Turkey
-
 UAE
UAE
-
 Uganda
-
 Ukraine
-
 United Kingdom
-
United States
-
 Uruguay
-
 Uzbekistan
-
 Venezuela
-
 Vietnam
-
 Yemen
Yemen
-
 Zambia
-
 Zimbabwe
- Forex
- Crypto
